

This is the first in a series of deep-dive valuation posts, following some big share price moves in 2026.
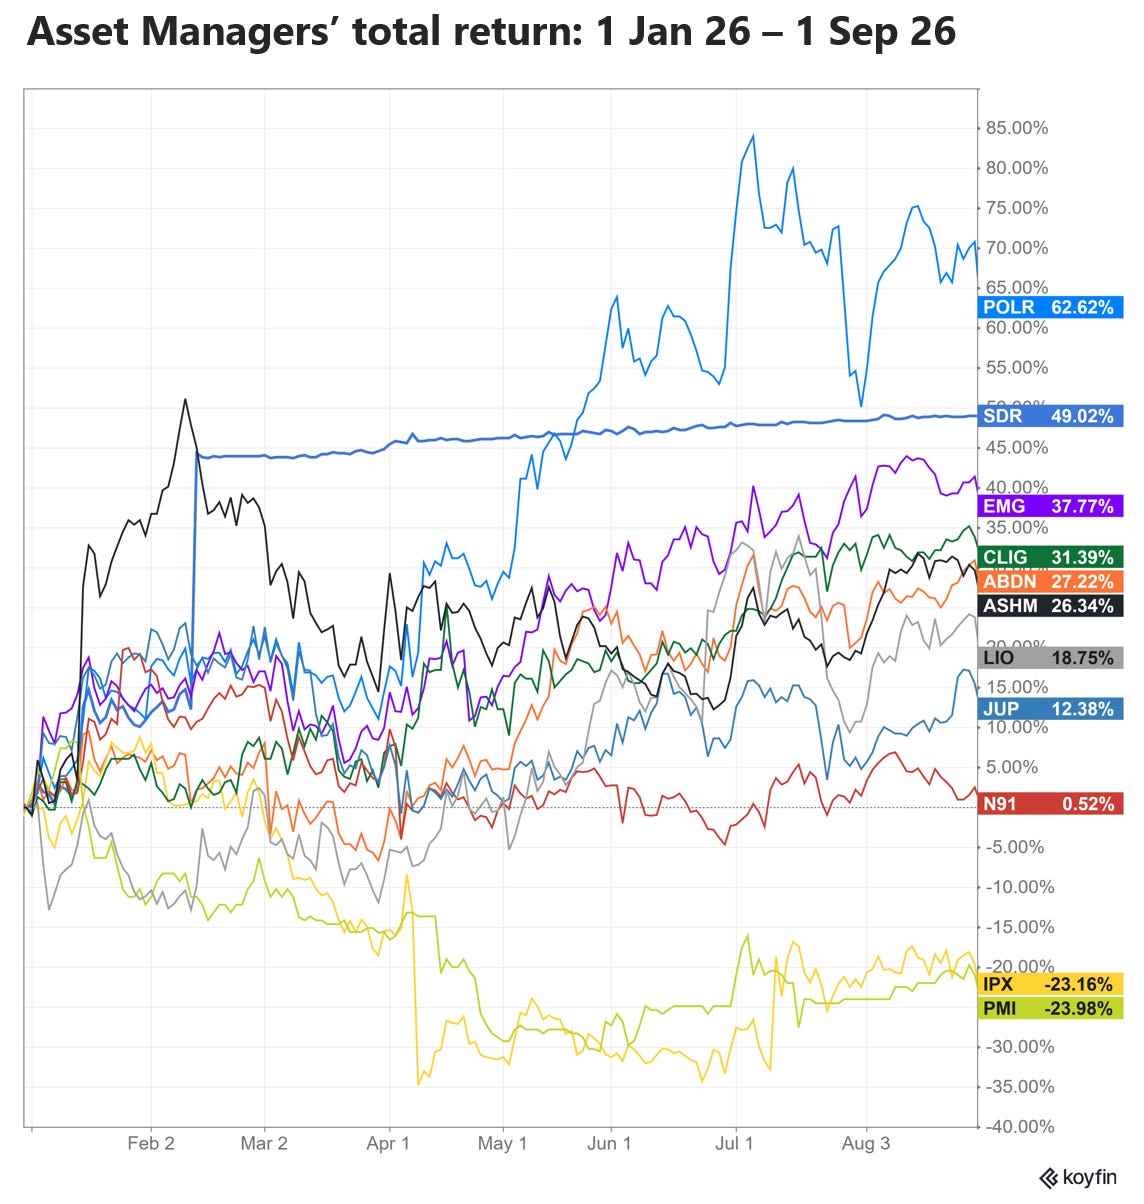
This first post in the series compares asset managers’ relative valuations, highlighting which companies look potentially over- or undervalued. I’ll then be publishing a series of company-specific valuation deep dives, starting with the extremes: those that appear deeply discounted or valued at a substantial premium, and testing whether those extremes are justified.
The UK Asset & Wealth Management newsletter and website is not investment advice. Please read the disclaimer here.
It might be tempting to simply compare PE ratios to assess relative valuation. But in the asset management space, balance sheet differences, acquisition accounting rules, and a few other things, expose some major flaws of the conventional PE ratio.
But making some adjustments for the items that most distort comparisons removes some of those flaws...
Balance sheets matter (a lot)
Typically, asset managers have little or no debt, are cash-rich, and hold significant investments on-balance-sheet (e.g. they seed funds with their own capital to align interests with outside investors).
But the size of cash piles and investments differ enormously, which has to be taken into account when comparing valuations. In this peer group, the value of net cash and investments varies from 12% to 50% of market cap.
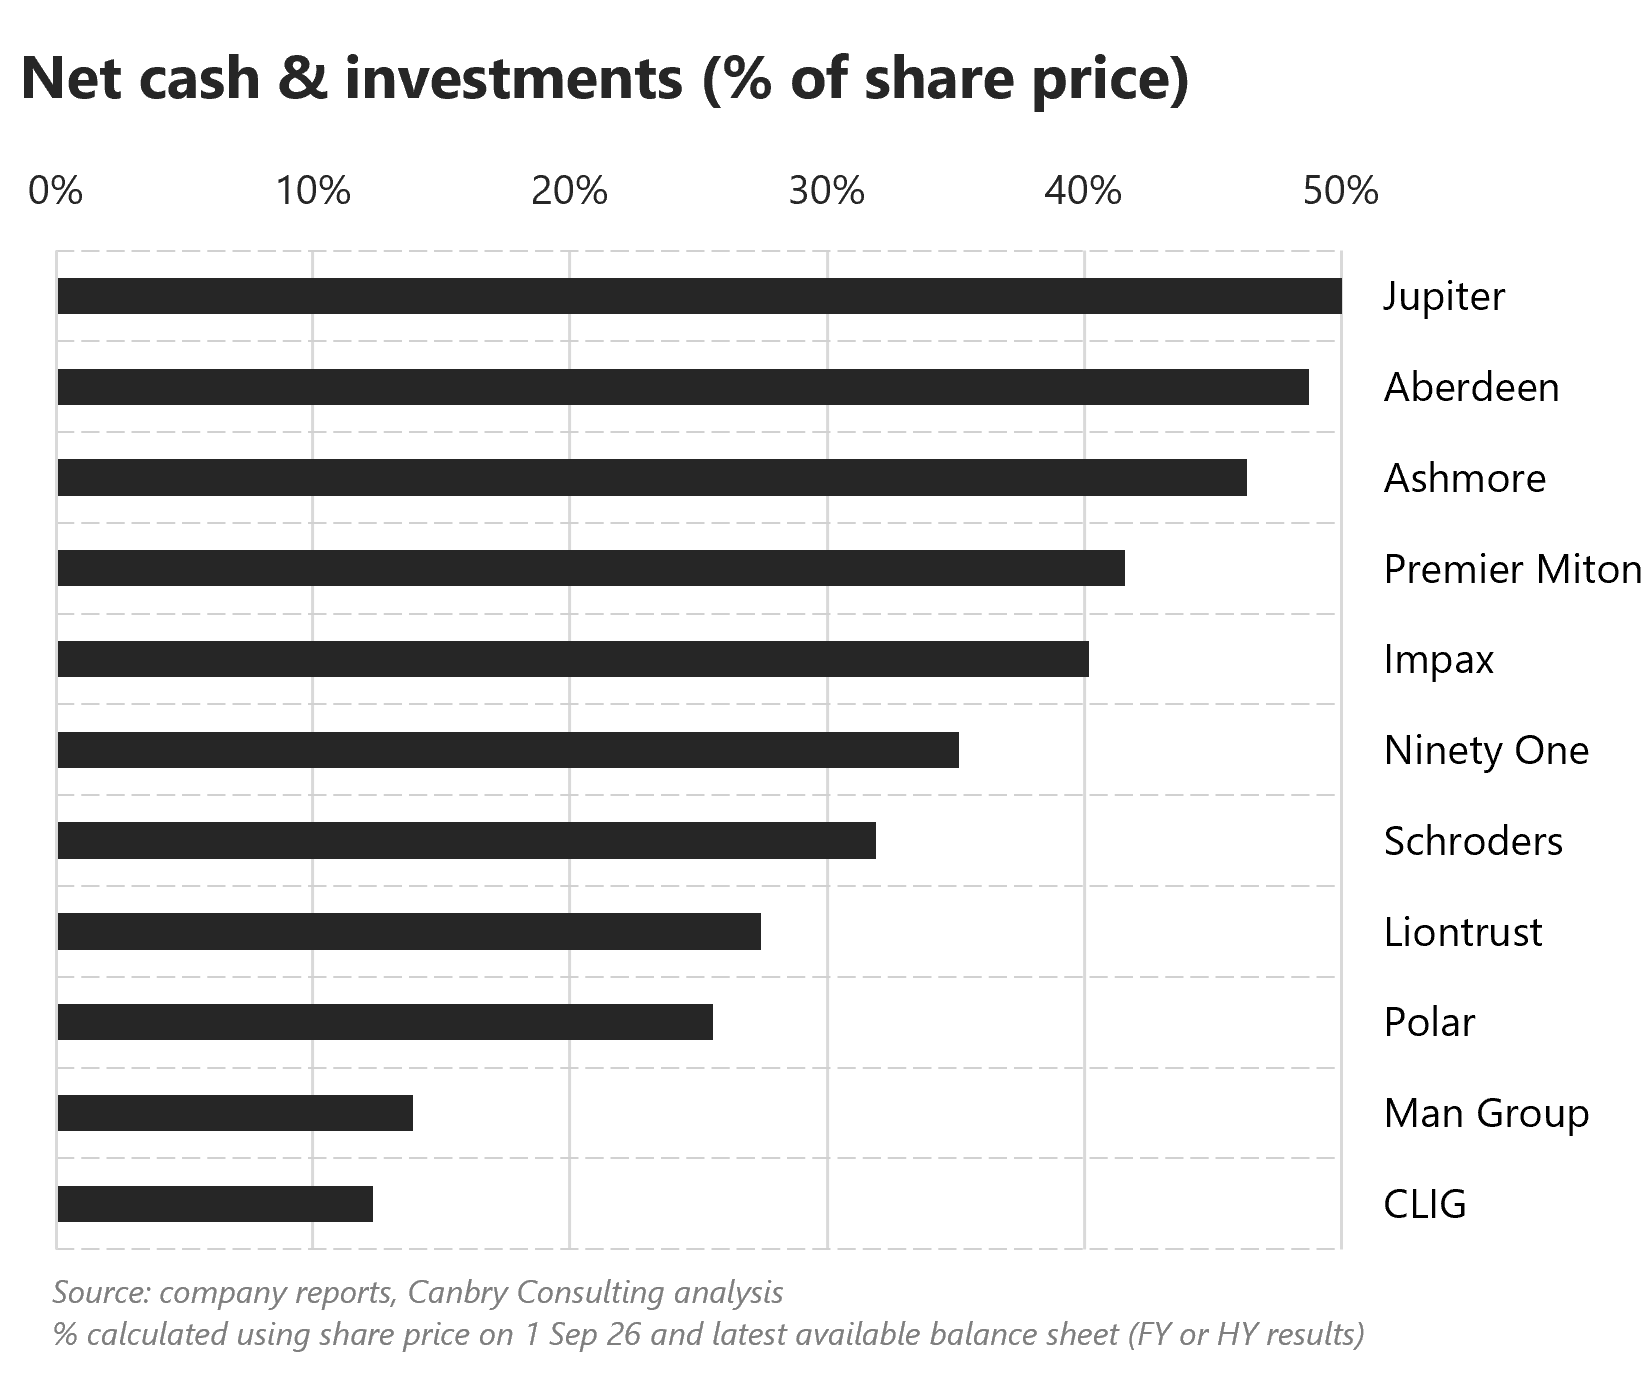
So even if two asset managers had similar profit margin and profit growth profiles, it would make no sense for them to have similar PE ratios if one manager’s cash and investments made up 50% of market cap, and the other 12%. (And remember this peer group hold mostly publicly traded assets so there shouldn’t be huge arguments about the value of investments - unlike in the private assets space).
These cash piles and investments also impact the income statement, often significantly. A large cash pile can generate significant interest income, and mark-to- market adjustments on investments can make for large moves in earnings.
Acquisition accounting creates outliers
The second anomaly which can distort relative valuations arises from amortisation charges following an acquisition. A few asset managers have made acquisitions over the last few years. They usually book an intangible asset on their balance sheet (e.g. ‘acquired customer relationships’) and then amortise that asset over time.
This non-cash cost can be significant. For example, in Liontrust’s most recent results (FY26), it was £9.1m, compared to PBT of £14.4m, so it pushes profits down and has a huge inflating impact on the ‘statutory’ PE ratio (20.7 versus a sector median of 13.2). Without that charge, Liontrust’s PE ratio would be around 12x.
Amortisation of customer relationships is arguably of very little significance to company fundamentals. It’s more of a theoretical construct to satisfy accounting conventions, and nothing like the amortisation of software say (a very real charge, just spread out over time by amortisation accounting).
Stripping out valuation distortions
So to compare the valuations of this group of asset managers, I am going to use a modified PE ratio, which I’ve previously called an ‘underlying PER’ or U-PER.
For the numerator (price), I’m going to strip out the value of cash and investments from the share price (see chart above for how significant this is by company).
For the denominator (earnings), I’m going to add back the amortisation of customer relationships. I’m also going to add back finance income, investment income (or losses), exceptional items (usually acquisition-related expenses or re-structuring costs) and the impact of performance fees (extremely volatile with no guarantee of being earned in the future).
This exercise gives an extremely useful relative valuation view between asset managers. It strips out a lot of the noise found in ‘conventional’ PE Ratios and teases out which asset managers’ share prices are baking in significant earnings growth from their core fee-earning fund management operations, or not.
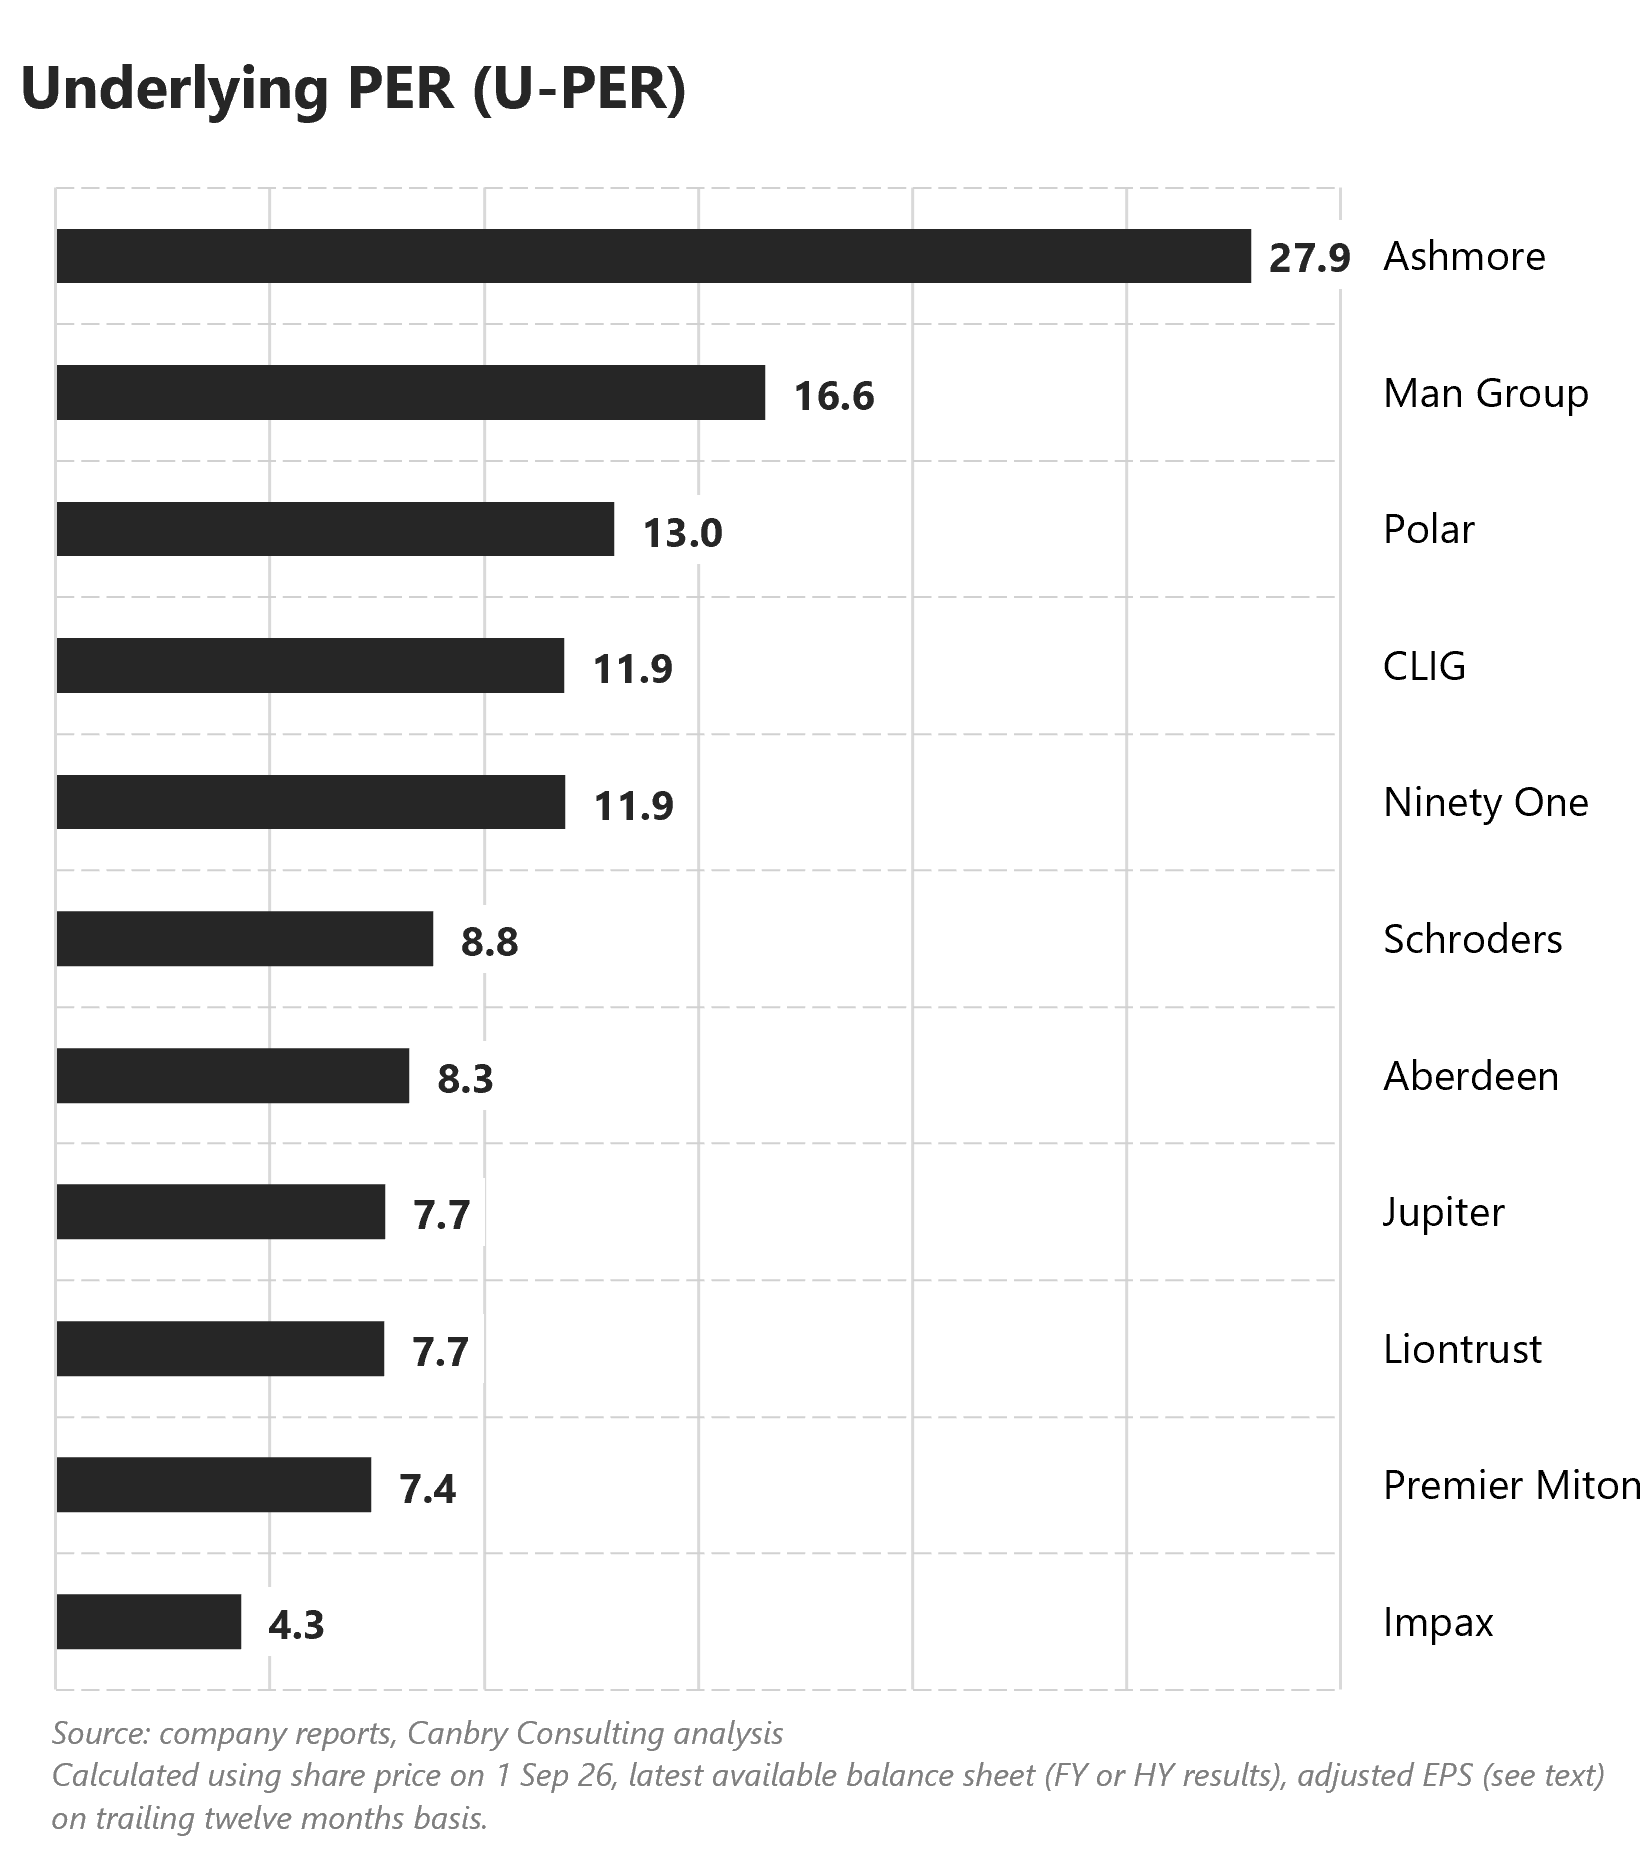
[Remember the above values ignore a significant part of the balance sheet and some important but volatile income statement items: performance fees, fair value adjustments etc, so the absolute values of these U-PERs are not that useful].
Putting the U-PER to work
The U-PER chart throws out some obvious questions, which become useful starting points to look for valuation anomalies in the asset management sector, for example:
Can Ashmore, Man Group, and Polar justify their premium valuations for their underlying fee-earning businesses? All three (especially Polar) have been strong performers recently so we might expect premiums (link to my recent post showing this below). But do the size of those premiums make sense (especially for Ashmore)?

Are the depressed valuations of Impax (especially), Premier Miton, and Liontrust justified? They have certainly been through torrid periods, but have share prices overreacted?
Why does Jupiter have such a lowly relative valuation when it has actually been quite a strong performer recently?
I’ll be digging into these questions and others in some detail on a company-by-company basis, starting in a few days. Be sure to keep an eye out for those posts.
If you haven’t done so already, please subscribe to UK Asset & Wealth Management below to receive these updates and to keep up to date with the UK asset and wealth management sectors.
And if you think Asset & Wealth Management is worth telling others about and sharing, I’d be most grateful if you do.
Disclosure: At the time of writing, Paul Bryant was a shareholder in a number of the companies mentioned in this publication, and covered Impax Asset Management and Polar Capital as an analyst on behalf of Equity Development Limited. Read Equity Development’s research on these companies by clicking on each. And please read this link for the terms and conditions of reading Equity Development’s research.
Looking forward to the series!