Sprinters, joggers, walkers, stumblers
In UK wealth management, disparity makes for a stock-pickers' paradise

TheInvestors.blog is not investment advice. Please read the disclaimer here.
Looking at the share price moves in the chart below (a period of just over a year), it’s hard to believe these companies are in the same sector. What’s more, they’re in the boring old UK-listed wealth management sector.
Shouldn’t there be some stability in this space? After all, these companies manage/advise/administer individual investors’ fund, ISA and pension portfolios. These portfolios usually keep growing as they get drip-fed by investors come rain or shine (they are also subject to market pull-backs of course). And in turn, these companies earn a steady stream of recurring fees, typically a percentage of the funds they manage.
So how can the St James’s Place share price tank by more than 40% before ending up more than 60% in the green? Why have PensionBee, Quilter, and Hargreaves Lansdown risen by more than 50%? Why has the Rathbones share price gone nowhere? And why has Brooks Macdonald been on a tortuous steady decline?

The answer is that it’s a complex potpourri of ambition, excellence, own goals, bouncing back from own goals, acquisitions… you name it. But one thing is for sure… sector-wide influences such as markets, the state of the economy, and tax changes have recently mostly taken a back seat to company-specific factors.
Maybe this sector is not so boring after all!
In this post, I’ll look at some of the numbers which set the scene for what’s going on in the London-listed wealth management space.
A mix of sizes and business models.
Some context first.
There are significant differences in size between the largest and smallest companies in this peer group, with St James’s Place, Hargreaves Lansdown and Abrdn’s wealth management arm (which includes the Interactive Investor platform), the giants of the space. Smaller players include Tatton Asset Management, Brooks Macdonald, and PensionBee.

There is also a fairly diverse mix of business models across advice, investment management, and distribution channel.

2024: A year of top-line growth
While all of these companies recorded AUA growth in 2024, growth rates differed dramatically, with two of the smaller players, PensionBee and Tatton, the runaway leaders.

Markets provided a tailwind, adding an average of 8% to AUA over 2024. But diverse net flow rates were clearly the main driver of the above AUA growth rate differences.

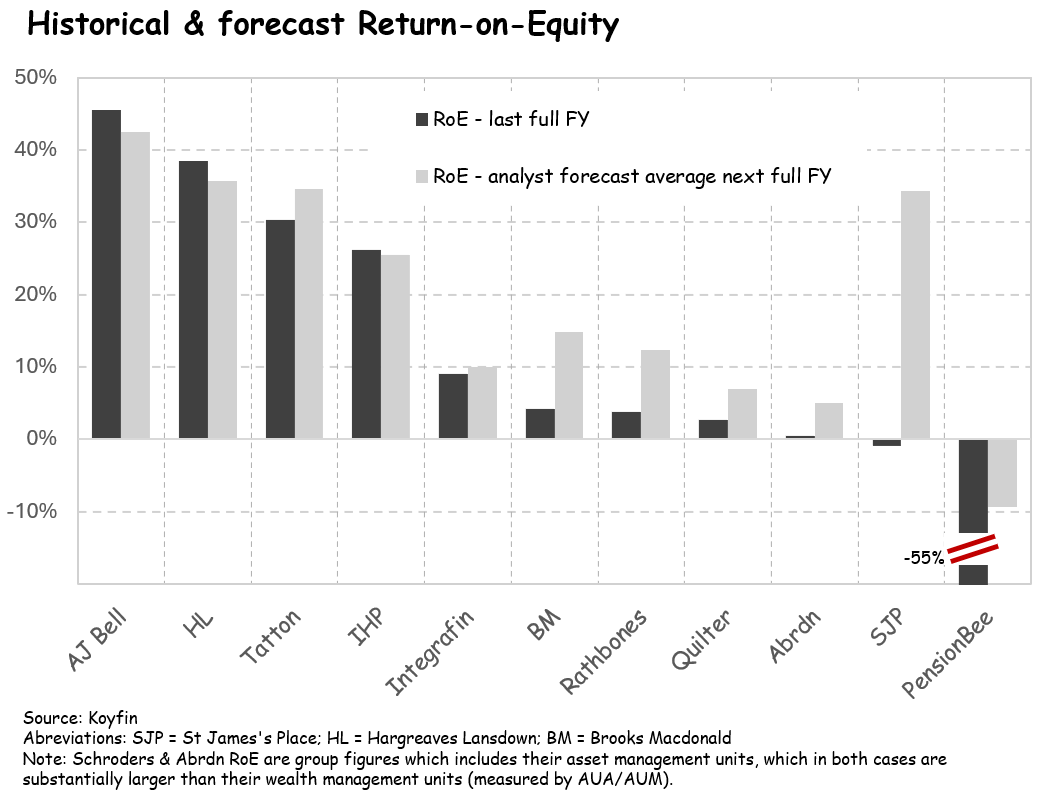
Huge profit disparity and fluctuations
When it comes to profitability, differences are even larger between companies and in some cases, very volatile between financial years within the same company.
Write-downs, provisions, acquisitions and acquisition accounting, and cost cutting exercises have played a big role in some cases. I’ll discuss this subject in more detail in part 2 of this post.
Stock-pickers’ paradise
All of the above makes for some fascinating valuation anomalies. Just look at the PE ratios of the last full financial year versus the forward PE ratios. They’re all over the place.
Be sure to subscribe to TheInvestors.blog below to keep up to date with the UK asset and wealth management sectors.
And if you think TheInvestors.blog is worth telling others about and sharing, I’d be most grateful if you do.
Disclosure: At the time of writing, Paul Bryant was a shareholder in a number of the companies mentioned in this publication.