2025: the great Asset Management bifurcation? (part 2 of 3)
Some are priced to win, some to lose, then there's a peloton with similar-looking valuations. What is Mr Market actually pricing in?

TheInvestors.blog is not investment advice. Please read the disclaimer here.
When you dig into valuations in the UK asset management sector, a segmentation becomes clear:
There’s a group ‘priced to win’, which seem to be performing well on fundamentals, and have share prices reflecting solid (but I wouldn’t say spectacular) growth expectations. Investors need to assess if these can keep performing.
There’s a group ‘priced to lose’, with some clear weaknesses in their fundamentals (at the moment). Investors need to assess if they can turn things around. There could be huge rewards for those calling a turnaround correctly.
Then there’s a ‘peloton’, with a mixed back of fundamentals, opportunities and risks, which are valued quite similarly. Investors need to evaluate who might make a break for the lead, or drop off the back.
In part 1, published a few days ago, I looked at assets under management (AUM) movements over 2025. It’s important context for this post and I’d recommend reading it before this one.

Who’s trading at a premium, who’s at a discount?
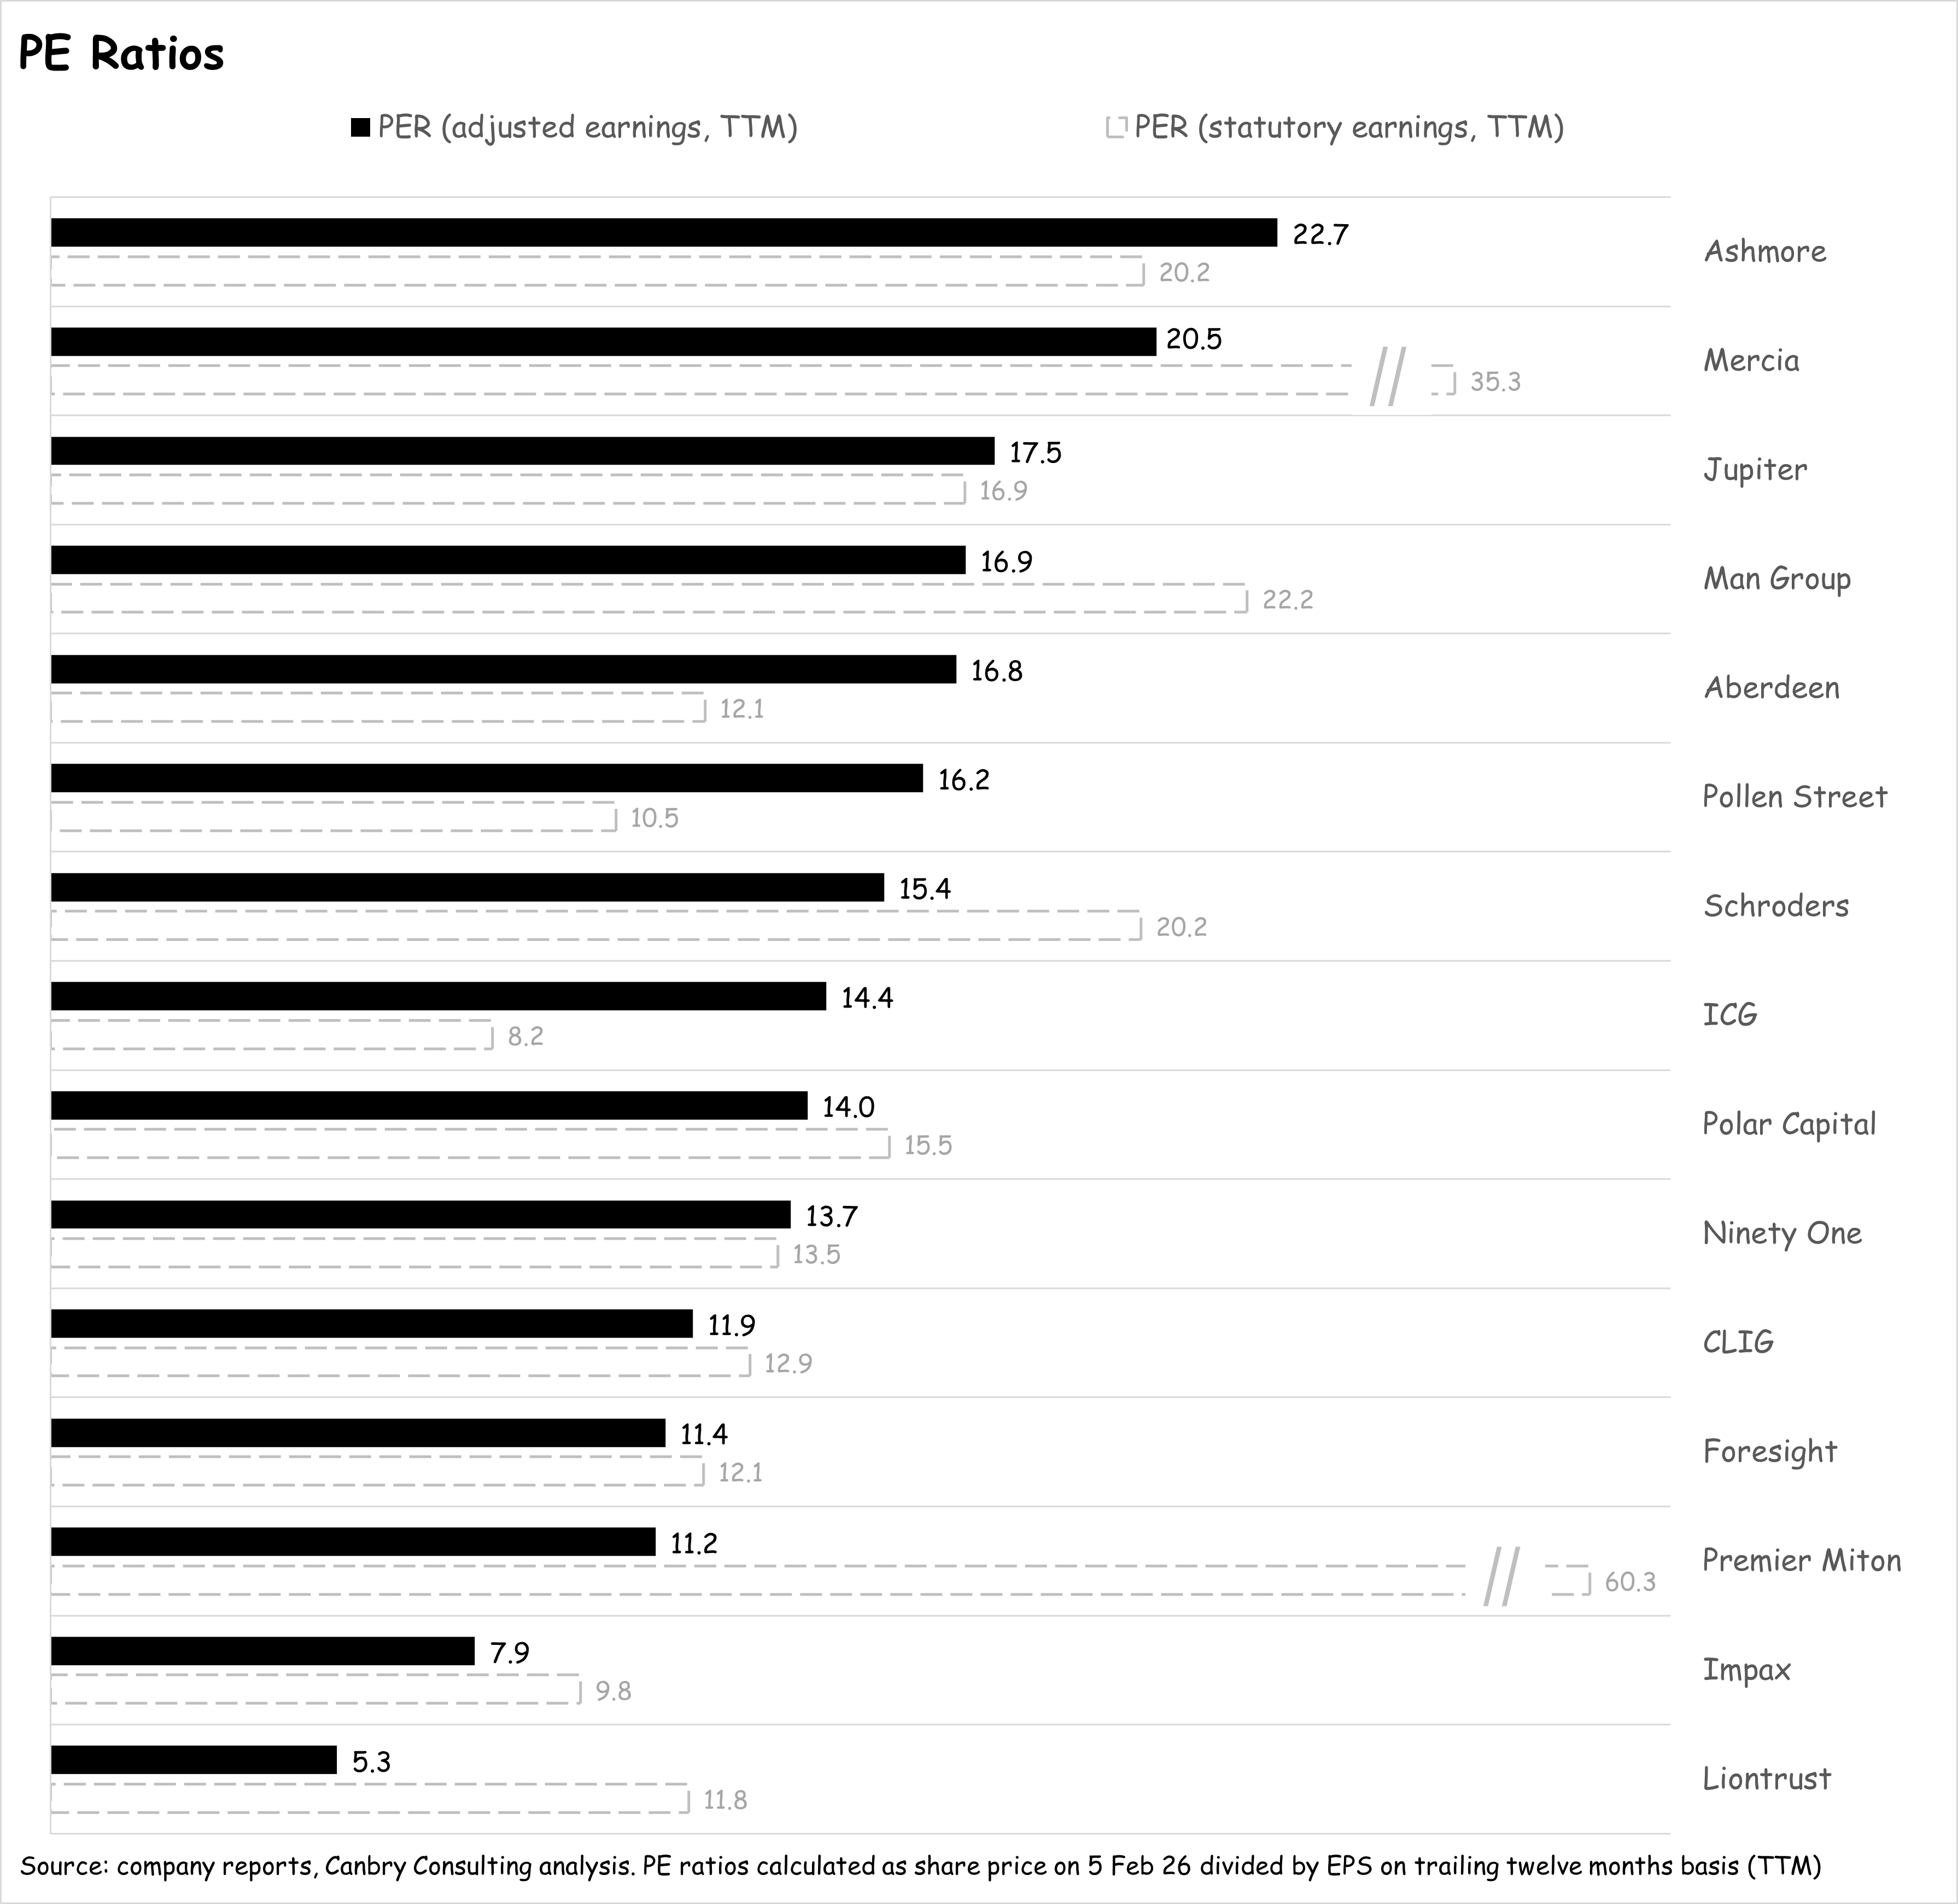
PE ratios can be misleading in the asset management sector. If calculated using statutory earnings, they can get heavily distorted in some cases. The three main culprits are:
Amortisation arising from acquisition accounting: Quite a few AMs have made acquisitions over the last few years and as part of this, usually book an intangible asset on their balance sheet (e.g. ‘acquired customer relationships’) and then amortise that asset over time. This non-cash cost can be significant. For example, in Premier Miton’s latest results, this amortisation charge was £5.2m, compared to PBT of £2.4m, so it has a huge inflating impact on the ‘statutory’ PE ratio, pushing it to more than 60 in this case, which I think is fair to say is a misleading ratio.
Movements in the value of on-balance-sheet investments: AMs often have investments on their balance sheet (e.g. they might invest their own capital to seed a new fund) which are sometimes very significant in relation to the size of their balance sheet (more detail below). These usually get marked-to-market with the change in value running through the income statement. This gain or loss can sometimes be significant and again distort earnings and PE ratios. For example, in its latest half-year results, ICG’s income statement recorded net gains on investments of £137m compared to PBT of £354m, which deflates its statutory PE ratio.
Exceptional/non-recurring charges: Usually related to acquisitions, or to ‘one-off’ transformation/restructuring programmes.
So, it’s useful to look at PERs with the above items stripped out of earnings. In the chart below I show these ‘adjusted’ PERs (black bars) as well as PERs based on statutory earnings (grey dotted bars) to illustrate how PERs for the same company can be wildly different depending on how you measure earnings.
But even the above adjusted PE ratios are not quite telling the whole story. Baked into share prices are, in some cases, very substantial net cash positions and very substantial on-balance sheet investments. Well, they should be baked into the share price - I’m not convinced they actually are in all cases.”
In the chart below, I show the latest available net cash and net on-balance-sheet investment value (combined) as a percentage of share price.
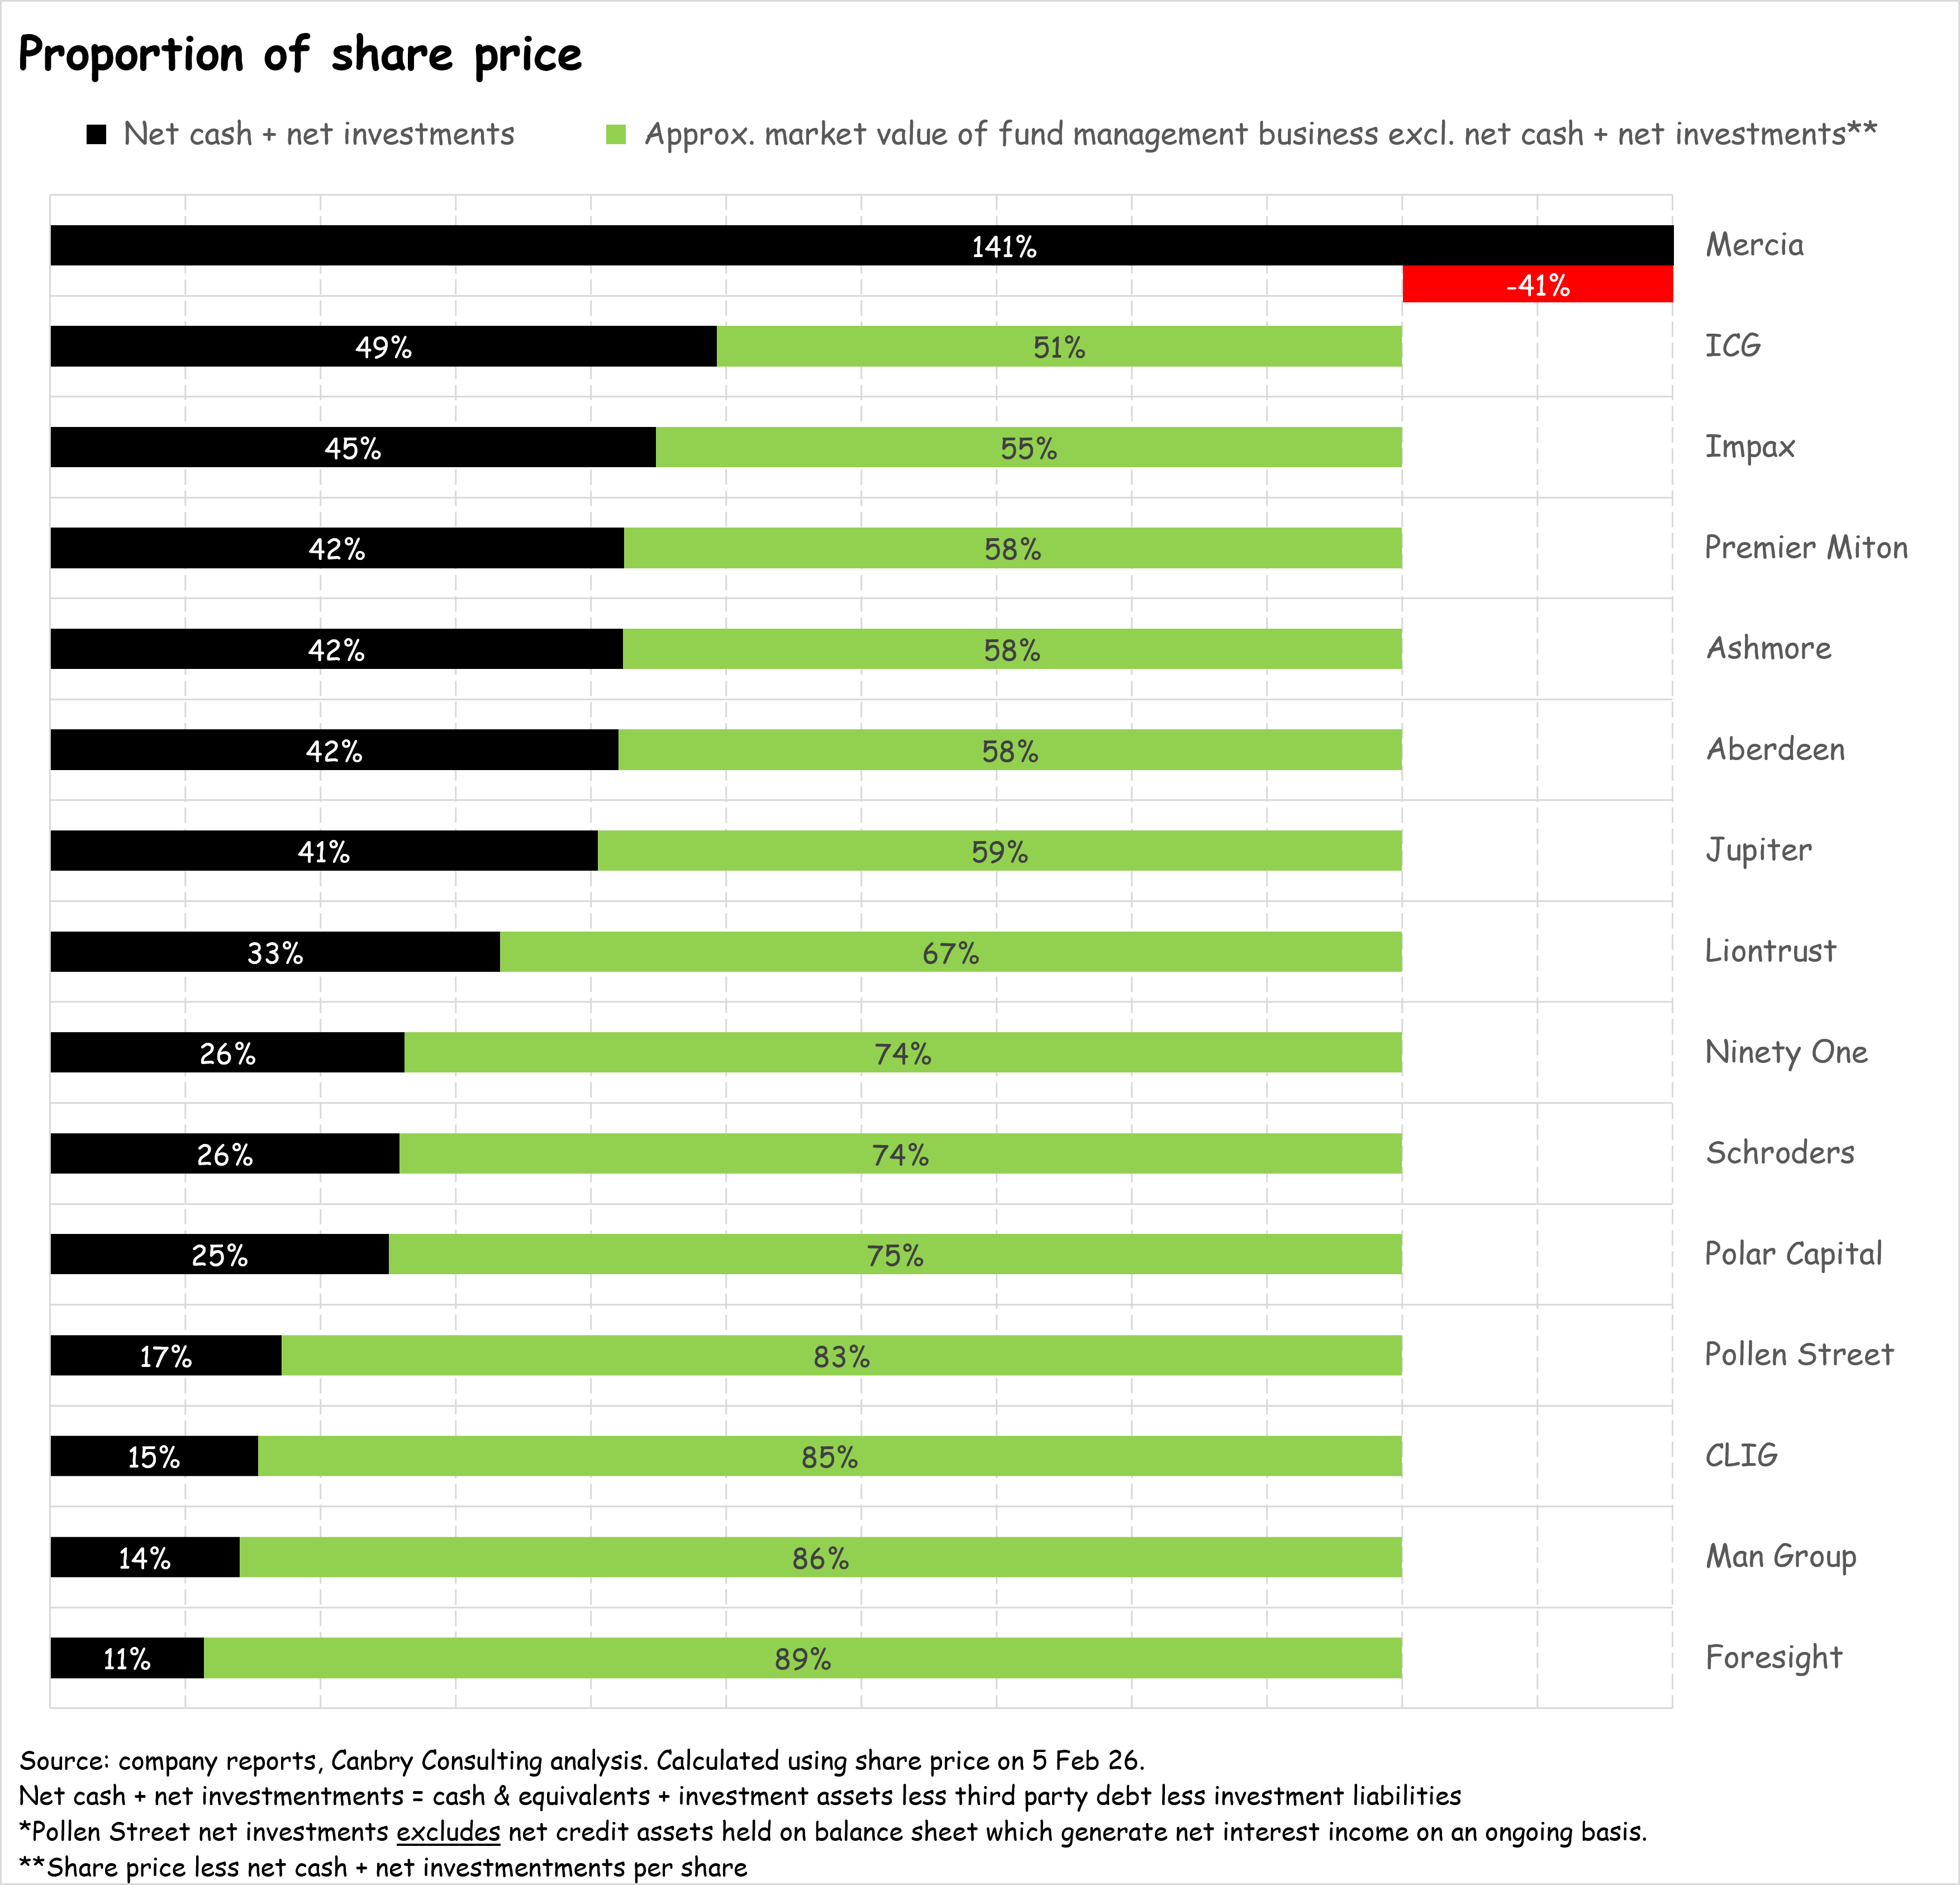
The difference between that balance sheet value and the share price are the green bars above (red in the case of Mercia – an extreme outlier – see further commentary below), which I’ve labelled as an approximate market value of fund management business. That’s anything but perfect because of course asset managers need some cash for regulatory compliance and to run their business and sometimes need to invest in their own funds to build clients’ confidence - you can’t totally isolate these balance sheet items. But it is useful to highlight the scale of some asset managers’ cash piles and investment portfolios.
So for an even better relative comparison of asset managers’ valuations, we can strip out the value of the above balance sheet items from the share price, and create a ‘balance-sheet-adjusted PER’, which deducts the net cash and net investments per share from each company’s share price, and then divides that by adjusted earnings per share.
On a standalone basis, the absolute values of these PERs are not that useful (as part of these balance sheet items are necessary to generate earnings), but the relative value of these PERs between asset managers is extremely useful. It strips out a lot of the noise found in ‘normal’ PE Ratios and really does tease out which asset managers’ share prices are baking in earnings growth, or not.
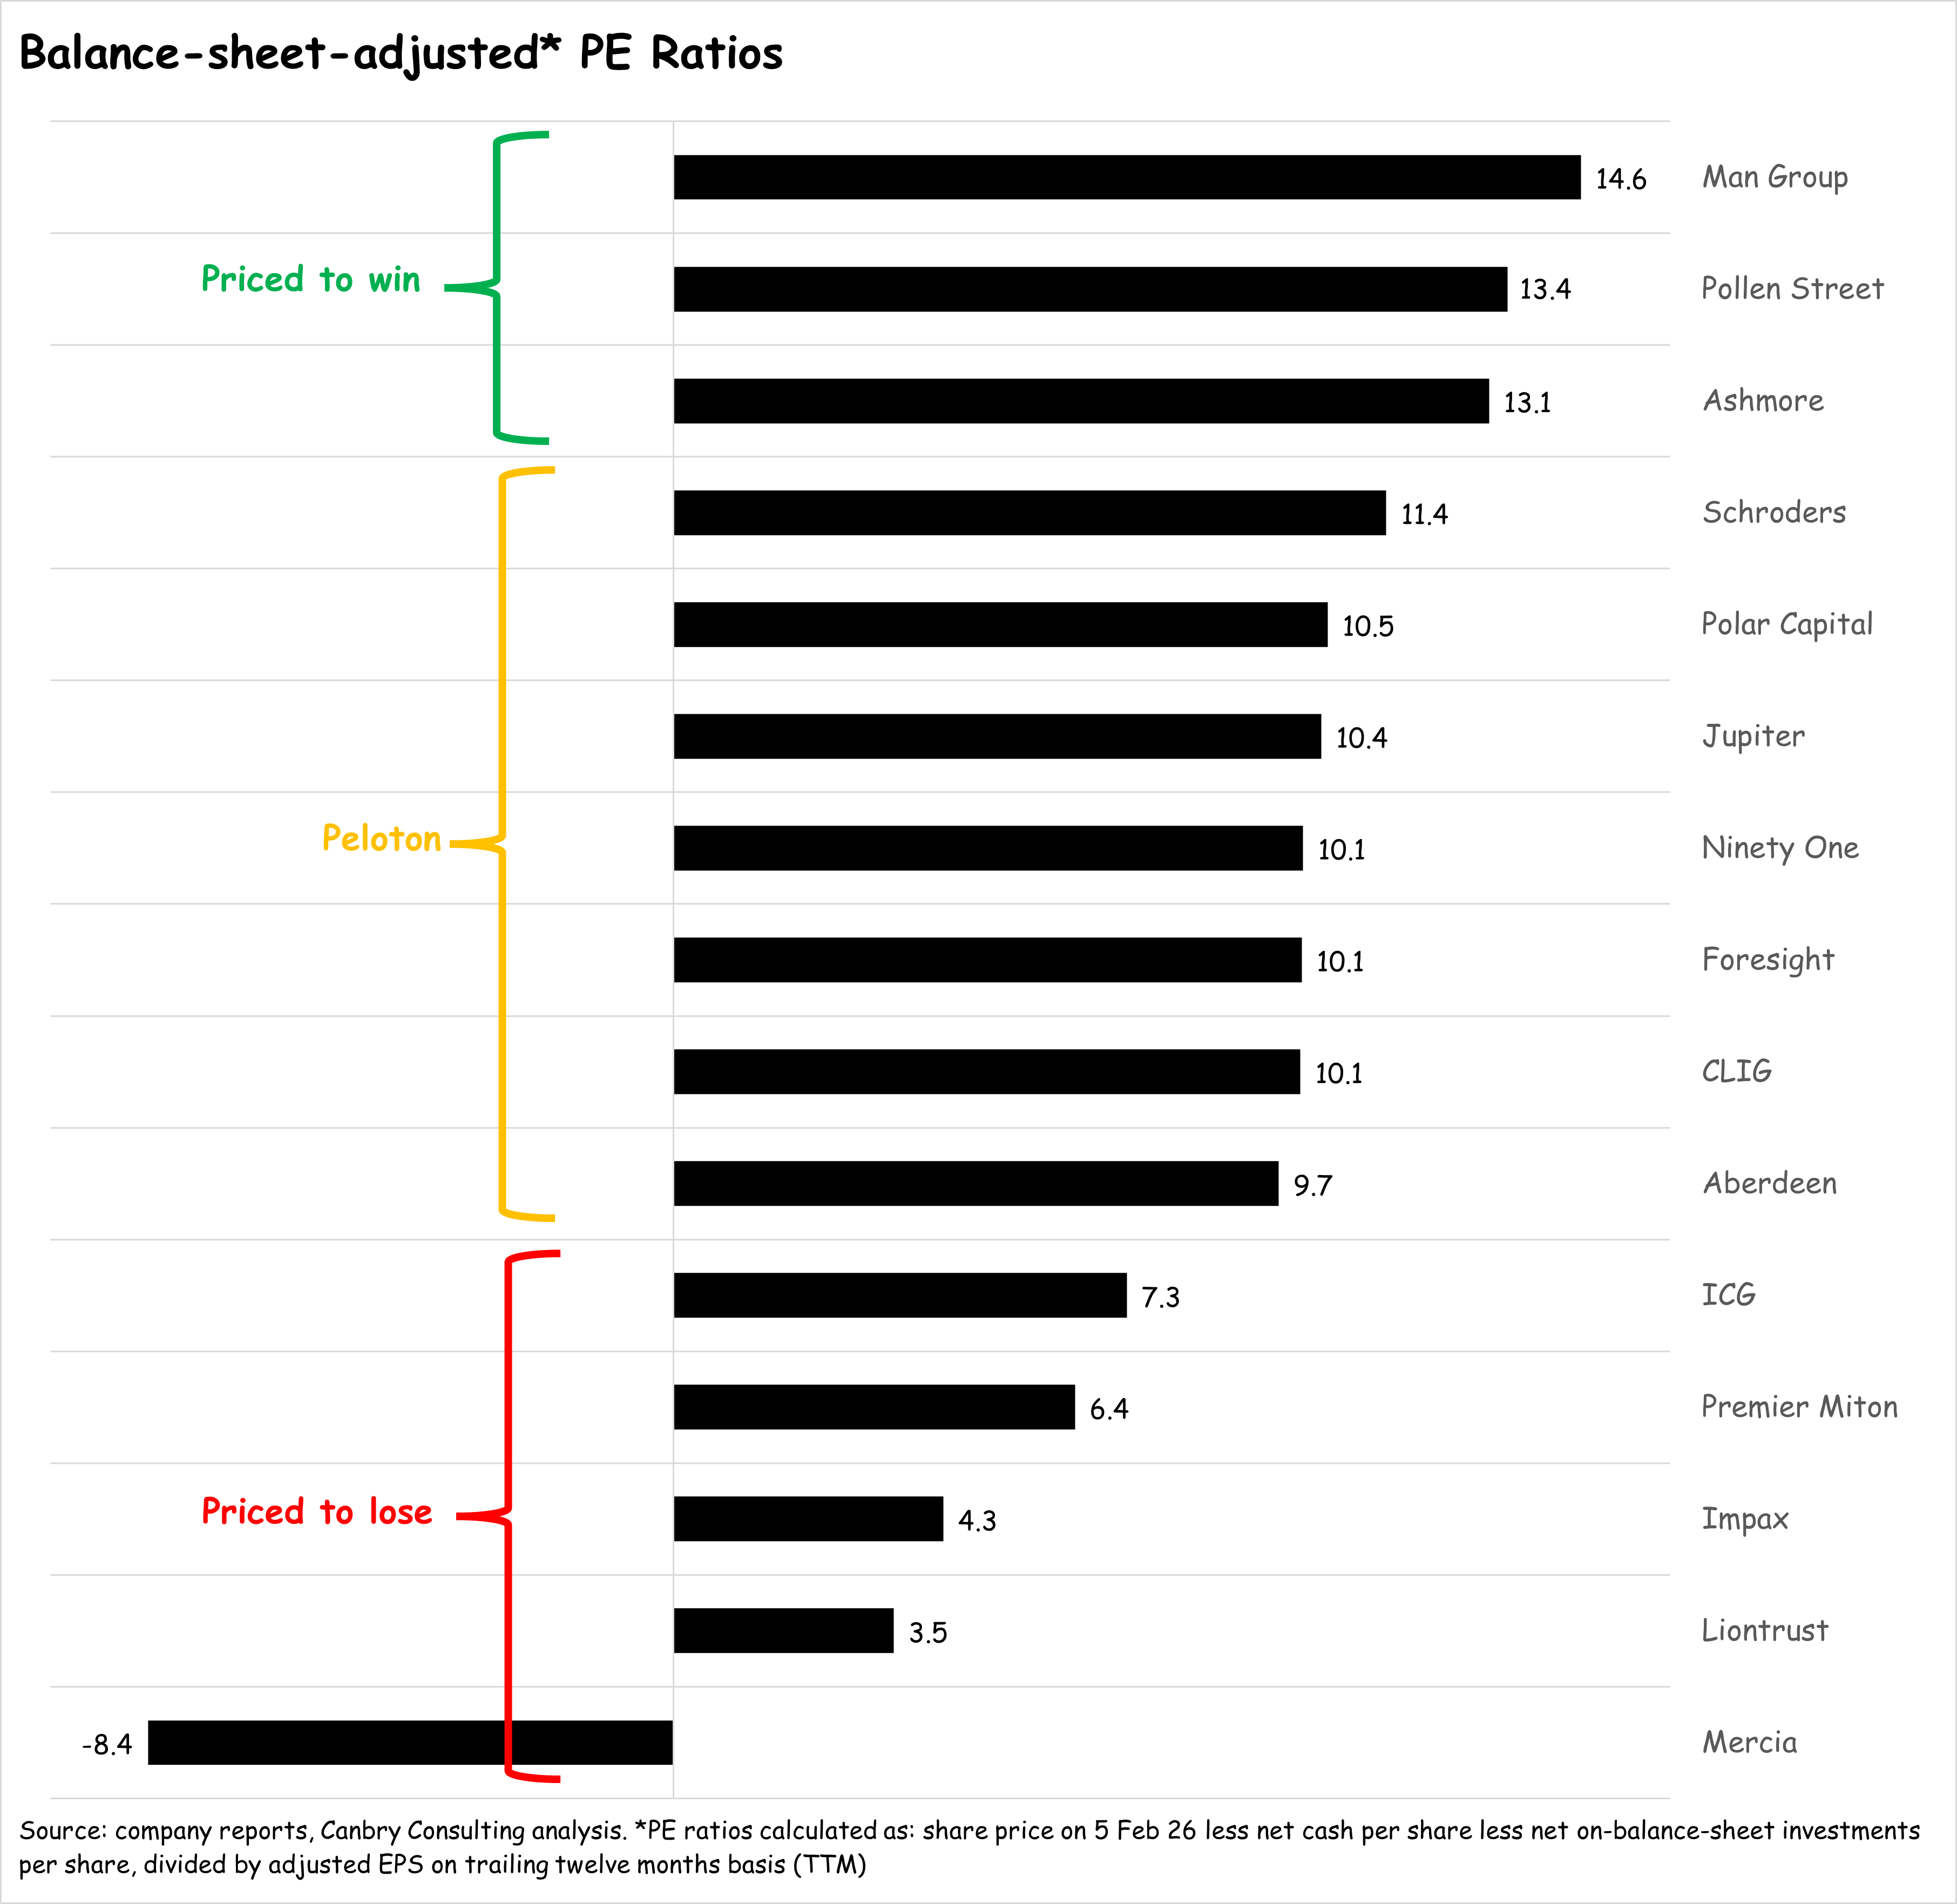
Priced to win
Three asset managers are clearly priced for higher earnings growth than others: Man Group, Pollen Street, and Ashmore. There’s a case to be made that this makes sense, but investors need to really dig into the details:
Man Group
It has recorded the strongest net flows by some margin in recent times (see part 1 of this post) and has clearly got an attractive offering to many clients. It’s ‘quant focus’ is a key differentiator. The share price has staged a significant recovery after heavy falls in 2024 and early-2025. It looks well placed fundamentally but a fair amount of earnings growth is already priced in. Investors also need to have a stomach for volatile earnings as a result of the significance of its performance fees. Keep a look out for 2025 results - to be released on 26 Feb 26.
Pollen Street
This private equity and private credit specialist is also showing strong growth at AUM and earnings level. Its funds are attracting significant interest from investors all around the world with a Q3 trading update (to 30 Sep 25) showing AUM up 32% y-o-y. EBITDA was up 28% y-o-y in the half-year to 30 Jun 25. The share price seems to have been in a reasonably solid uptrend over the last two years or so. Keep a look out for 2025 results - usually out in late-March.
Ashmore
This emerging markets fixed income specialist has had a torrid few years - in fundamental terms (huge outflows) and in share price terms (huge price falls). Much of that was clearly down to emerging markets being out of favour relative to the US. But that seems to have turned around (although it’s very early days). Net outflows slowed during 2025 and turned sharply positive in Q4. The share price has more than doubled since Apr 25 lows. Adjusted EBITDA is a fraction of what it used to be: £53m in the FY to 30 Jun 25, compared to £196m in the FY to 30 Jun 21. So there’s potential for a big earnings recovery, but that’s highly dependent on the net flow recovery continuing. Interim results are due on 12 Feb 26.
Priced to lose
Mercia
Mercia is a true outlier. You would no doubt have picked that up from the chart above showing a negative balance-sheet-adjusted-PE-Ratio. The share price discounts the value of its significant on-balance sheet investments by an enormous amount. This is so large I titled one of my more recent posts, summarising its interim results, as follows:

It looks to me that in this case, a high-quality asset management business is just fundamentally mispriced. But do your own research on this one. To help you, you may want to watch my recent interview with CEO Mark Payton here: In conversation with Dr Mark Payton (CEO).
Premier Miton, Liontrust, Impax
These have not (yet?) turned the corner that Ashmore (and others) have. They are still experiencing substantial outflows, and their share prices keep getting hammered. But I don’t think the future direction of their share prices is particularly complicated. They simply have to get back to positive net flows. If that happens, share prices are likely to jump. Just look at the share price reaction of Ashmore, Jupiter, and Ninety One when their flows turned around after prolonged periods of outflows. It was huge. Up 106%, 195%, and 113% from their Apr 25 lows respectively. If net flows don’t turn positive, these share prices are likely to keep lagging peers.
Can they do this?
Premier Miton
In its latest AUM update, Premier Miton recorded net outflows in all strategies except fixed income, which were positive. Equities experienced quite heavy outflows. It said: “
“…outflows from our US and European equity strategies continued into the current Period, reflecting investor risk aversion and the rotation away from growth‑oriented equities seen over recent quarters… Demand for our fixed income strategies remained robust… Although market conditions have been challenging, particularly for active equity managers, we are encouraged by the improvement in short‑term performance across several key strategies, particularly in the US. With interest rates now falling, we believe the environment for active equity investing should become more constructive as we move through 2026…”
Outflows can’t only be blamed on market conditions though. While most active equity managers have indeed experienced net outflows, not all have. Man Group, Schroders, and Jupiter (all with large equities franchises) have recorded positive net flows in most of 2025, and Polar was only very slightly negative. So I suppose it’s just about Premier Miton delivering on its cautiously optimistic outlook.
Liontrust
I find Liontrust a tricky one to evaluate. It has a very large UK-retail client base (through wholesale and other channels: around 86% of AUM is in UK retail funds, MPS, and Investment Trusts). But the recent narrative has covered more bases. There has been much talk about diversification. From a client-type diversification perspective, Liontrust has said it wants to grow its institutional client base. In a recent CityWire interview of CEO John Ions (worth a read), a big emphasis was on acquisitions and on the diversification benefits that could bring (products, geographies and distribution). He also emphasised up-skilling the sales team. So how all of that pieces together remains to be seen.
Impax
In the case of Impax, I’ve looked into this in some detail, and would refer you to my latest Equity Development research note. It’s been hard hit by outflows (an especially large St James’s Place mandate was lost). But Impax is highly focused and I reckon could turn the corner sooner rather than later. I wrote in the above note:
“Our expectation is that Impax will return to robust long-term growth. It operates in the sustainable investing space which, despite many headlines to the contrary, is a huge US$3.7trn market that is growing… Impax is uniquely placed… It has been focused on finding economically attractive investments within the sustainable transition for 27 years. It has not opportunistically ridden the ‘ESG bandwagon’. As others exit this space and the number of competing funds fall, Impax can thrive”.
But it’s not thriving yet.
In part three of this post, I’ll be looking into ‘The Peloton’, and evaluate who might make a break for the lead, or drop off the back.
Subscribe to TheInvestors.blog below to keep up to date with the UK asset and wealth management sectors.
And if you think TheInvestors.blog is worth telling others about and sharing, I’d be most grateful if you do.
Disclosure: At the time of writing, Paul Bryant was a shareholder in a number of the companies mentioned in this publication, and covered Impax Asset Management, Polar Capital, and Mercia Asset Management, as an analyst on behalf of Equity Development Limited. Read Equity Development’s research on these companies by clicking on each. And please read this link for the terms and conditions of reading Equity Development’s research.
Love your pieces, Paul, always very well researched and highly insightful. I am wondering as to your take on Nuveen's Schroders take over, and what impact this may have on other UK-based asset managers?