Is that chink of light an investment opportunity?
The state of play of UK-listed asset managers. Part 2: valuation, financials, strategic moves

TheInvestors.blog is not investment advice. Please read the disclaimer here.
In part 1 of this post, I looked at the state of play of assets-under-management - the crucially important ‘top-line’ for asset managers (link below).

In this part 2, I’m looking into how asset managers are faring on other metrics (especially profitability) and some of the more significant strategic and tactical goings-on: acquisitions, leadership changes, cost cutting etc. And probably most importantly, whether these fundamentals support current valuations.
It’s worth starting with an overview of valuations.
Stockpicker’s paradise
I’ve used PE ratios (PERs) for this overview. At sector level, these are not far off historical norms. The current median PER (based on statutory earnings) of the group of asset managers discussed in this post is 13.1x. According to Koyfin, the median historical 3-year average PER for the same group is 14.1x and the median 5-year average is 14.8x. So, there’s not really an argument to be made that the sector as a whole is due a substantial PER re-rating. Maybe just a small one.
But two other factors might provide shrewd investors with significant opportunities.
In many cases, earnings have fallen substantially over the last few years, driven mainly by falls in AUM (asset managers mostly earn revenue charging a fee based on a percentage of average AUM). If earnings recover (a big if, but they could recover quickly with AUM rises as many have undergone cost cutting exercises), share prices could jump substantially even if PERs do not move.
There is enormous disparity in PERs across the sector, with some AMs commanding healthy PER premiums, while others look deeply discounted. If those unloved managers start getting some love via a PER re-rating, which would in all likelihood be concurrent with an earnings recovery, there might be potential for a ‘double whammy’ share price rise.
That’s a nice theory. So, let’s look at the reality of those individual PER levels and the potential for earnings recoveries at an individual company level.
Will the real PE ratio please stand up?
We need to bear in mind that PERs based on statutory earnings can get distorted in the asset management space. In the chart below I present PERs using ‘adjusted earnings’ (black bars) to remove some common distortions (explained below the chart). I’ve also included PERs based on statutory earnings (grey dotted bars) to illustrate how PERs for the same company can be wildly different depending on how you measure earnings.
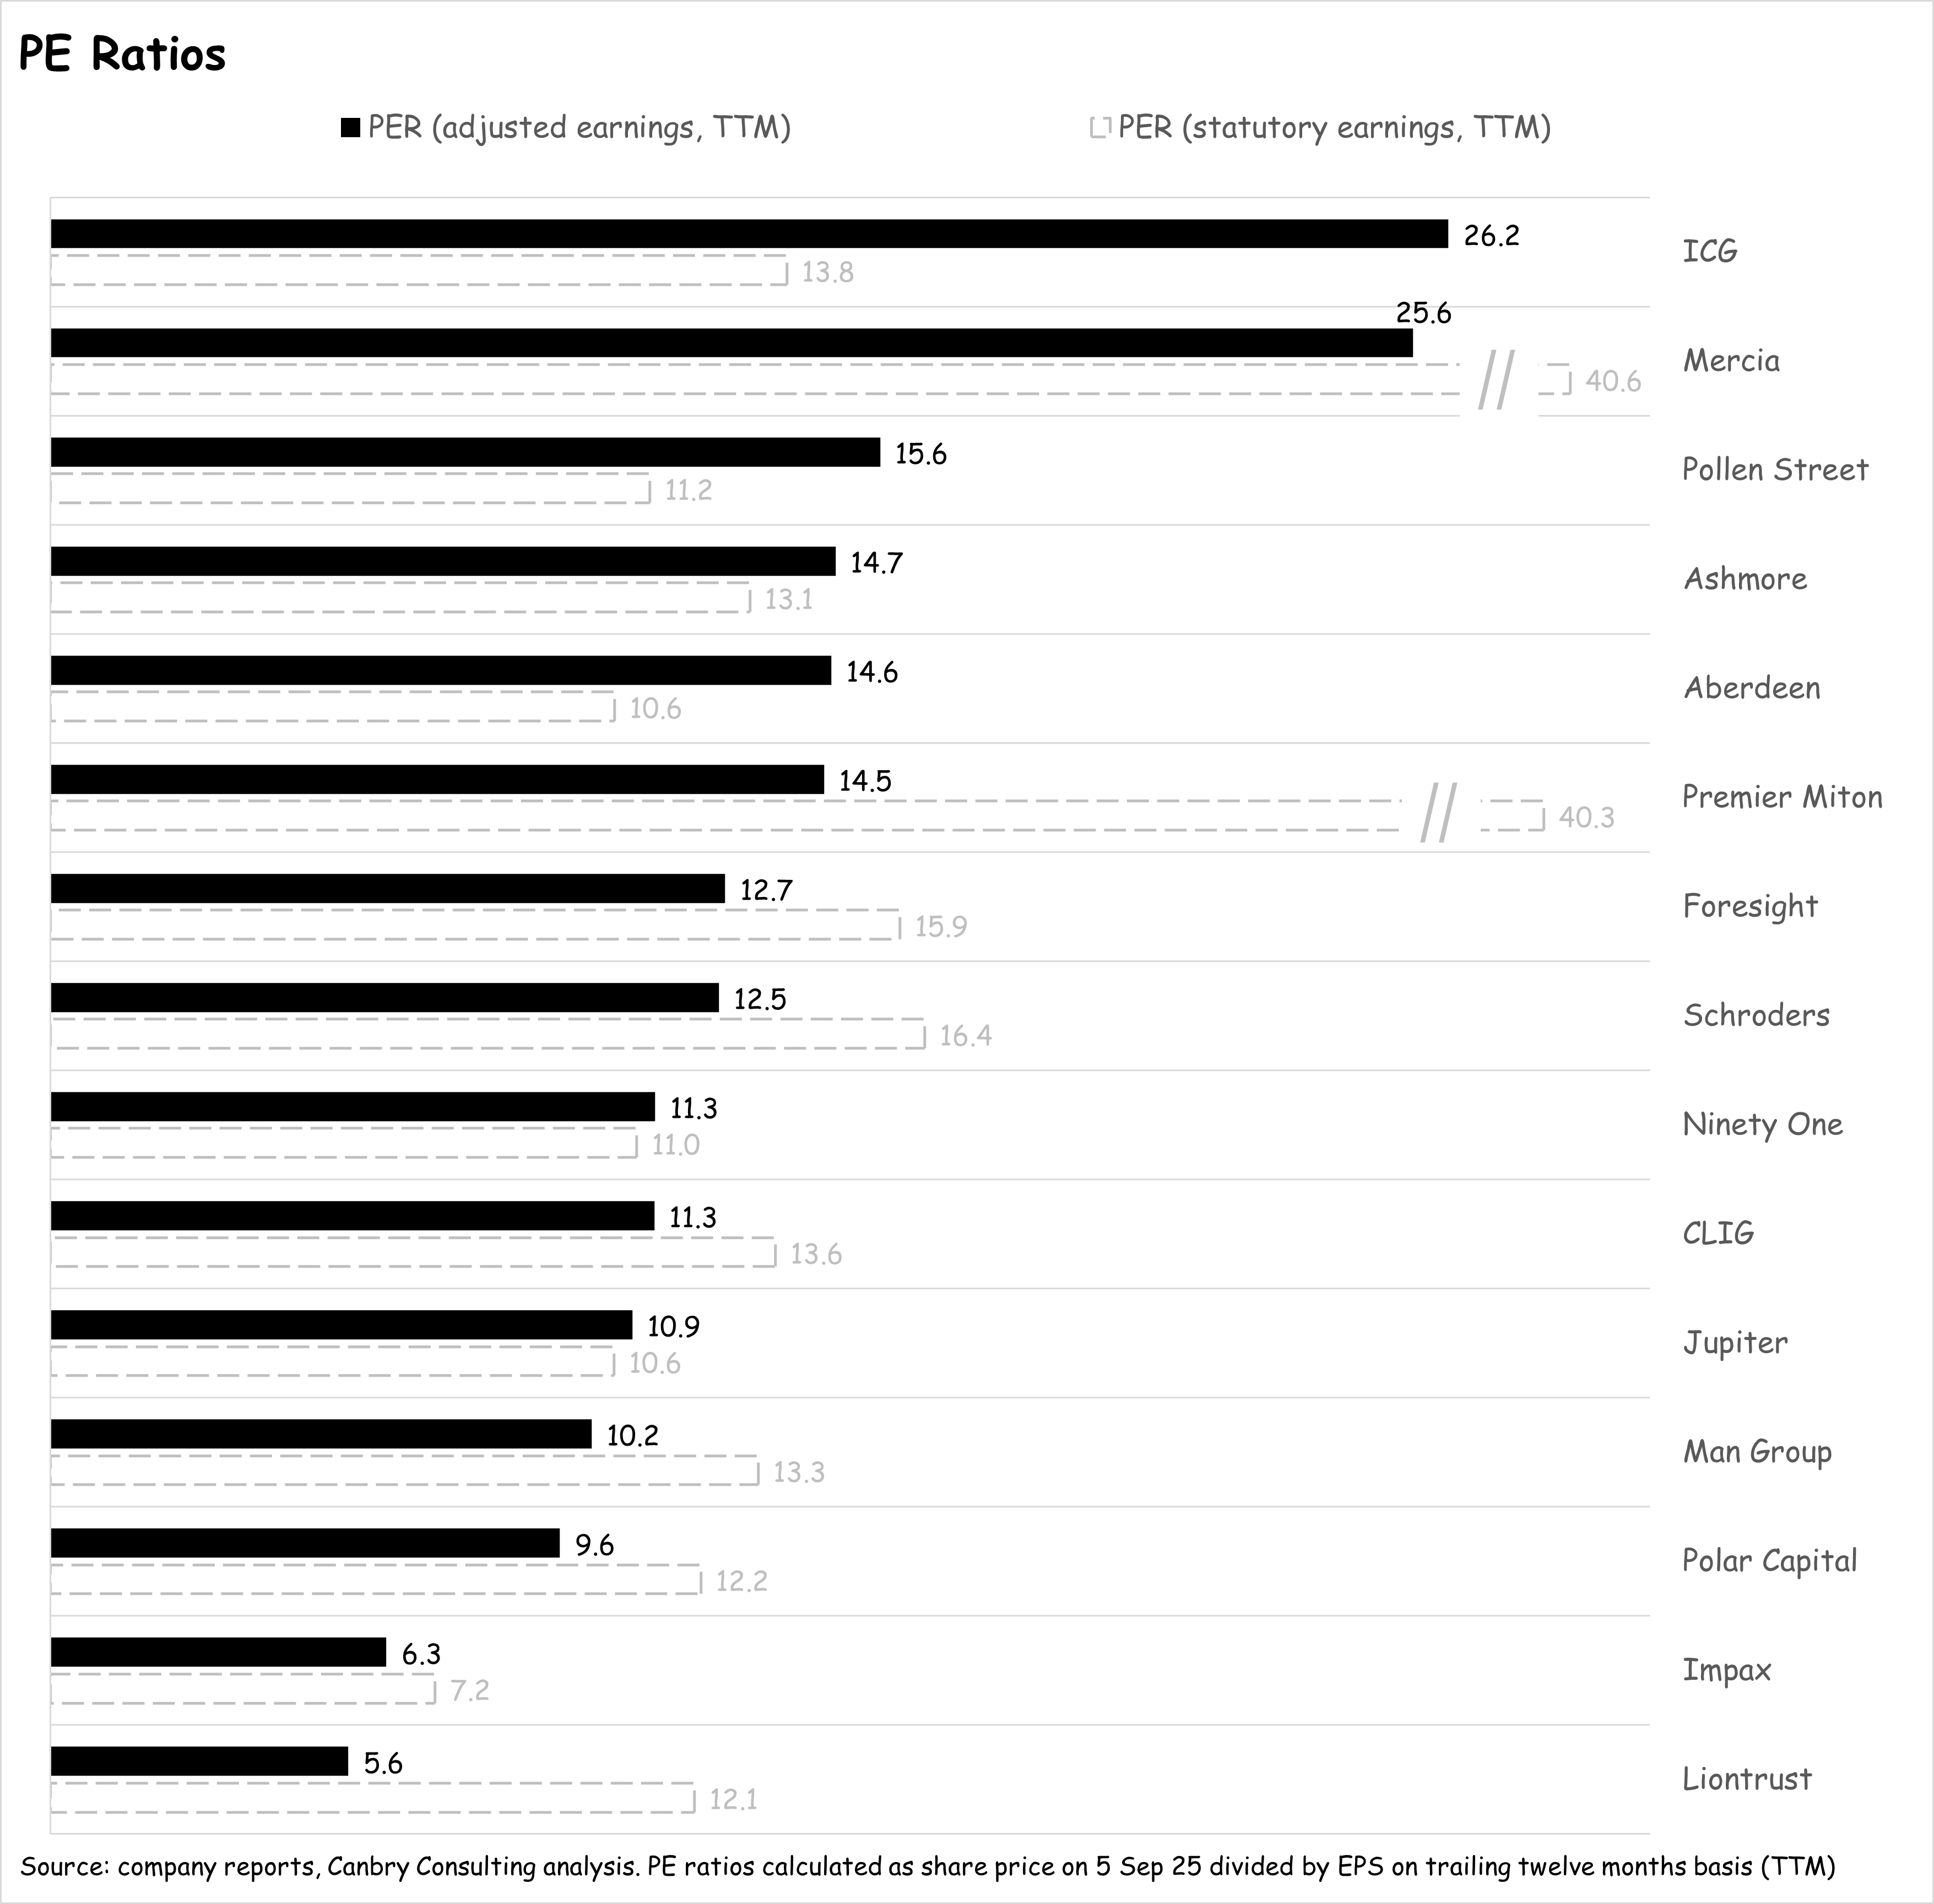
The three items which are included in statutory earnings but excluded from adjusted earnings are:
Amortisation arising from acquisition accounting: Quite a few AMs have made acquisitions over the last few years and as part of this, usually book an intangible asset on their balance sheet (called ‘acquired customer relationships’ or something to that effect) and then amortise that asset over time. This non-cash cost can be significant. For example, in Premier Miton’s latest half-year results, this amortisation charge was £2.6m, compared to PBT of £1.0m, so it has a huge inflating impact on the ‘statutory’ PE ratio.
Exceptional/non-recurring charges: Also usually related to acquisitions, quite a few AMs have significant one-off acquisition-related charges (professional fees etc) which can also distort earnings in a single period.
Movements in the value of on-balance-sheet investments: AMs usually have investments on their balance sheet (e.g. they might invest their own capital to seed a new fund) which are sometimes very significant in relation to the size of their balance sheet (more detail below). These usually get marked-to-market with the change in value running through the income statement. This gain or loss can sometimes be significant and again distort earnings and PE ratios. For example, in its latest results, ICG’s income statement recorded net gains on investments of £285m compared to PBT of £531m, which deflates its statutory PE ratio.
But even adjusted PE ratios are not quite telling the whole story. Baked into the share prices of these asset managers are, in some cases, very substantial net cash positions and very substantial on-balance sheet investments. Well, they should be baked into the share price - I’m not convinced they actually are in all cases. In the chart below, I show the latest available net cash and net on-balance-sheet investment value (combined) as a percentage of share price.
The difference between that balance sheet value and the share price are the green bars below, which I’ve labelled as an approximate market value of fund management business. That’s anything but perfect because of course asset managers need some cash for regulatory compliance and to run their business and sometimes need to invest in their own funds to build clients’ confidence - you can’t totally isolate these balance sheet items. But it is useful to highlight the scale of some asset managers’ cash piles and investment portfolios.
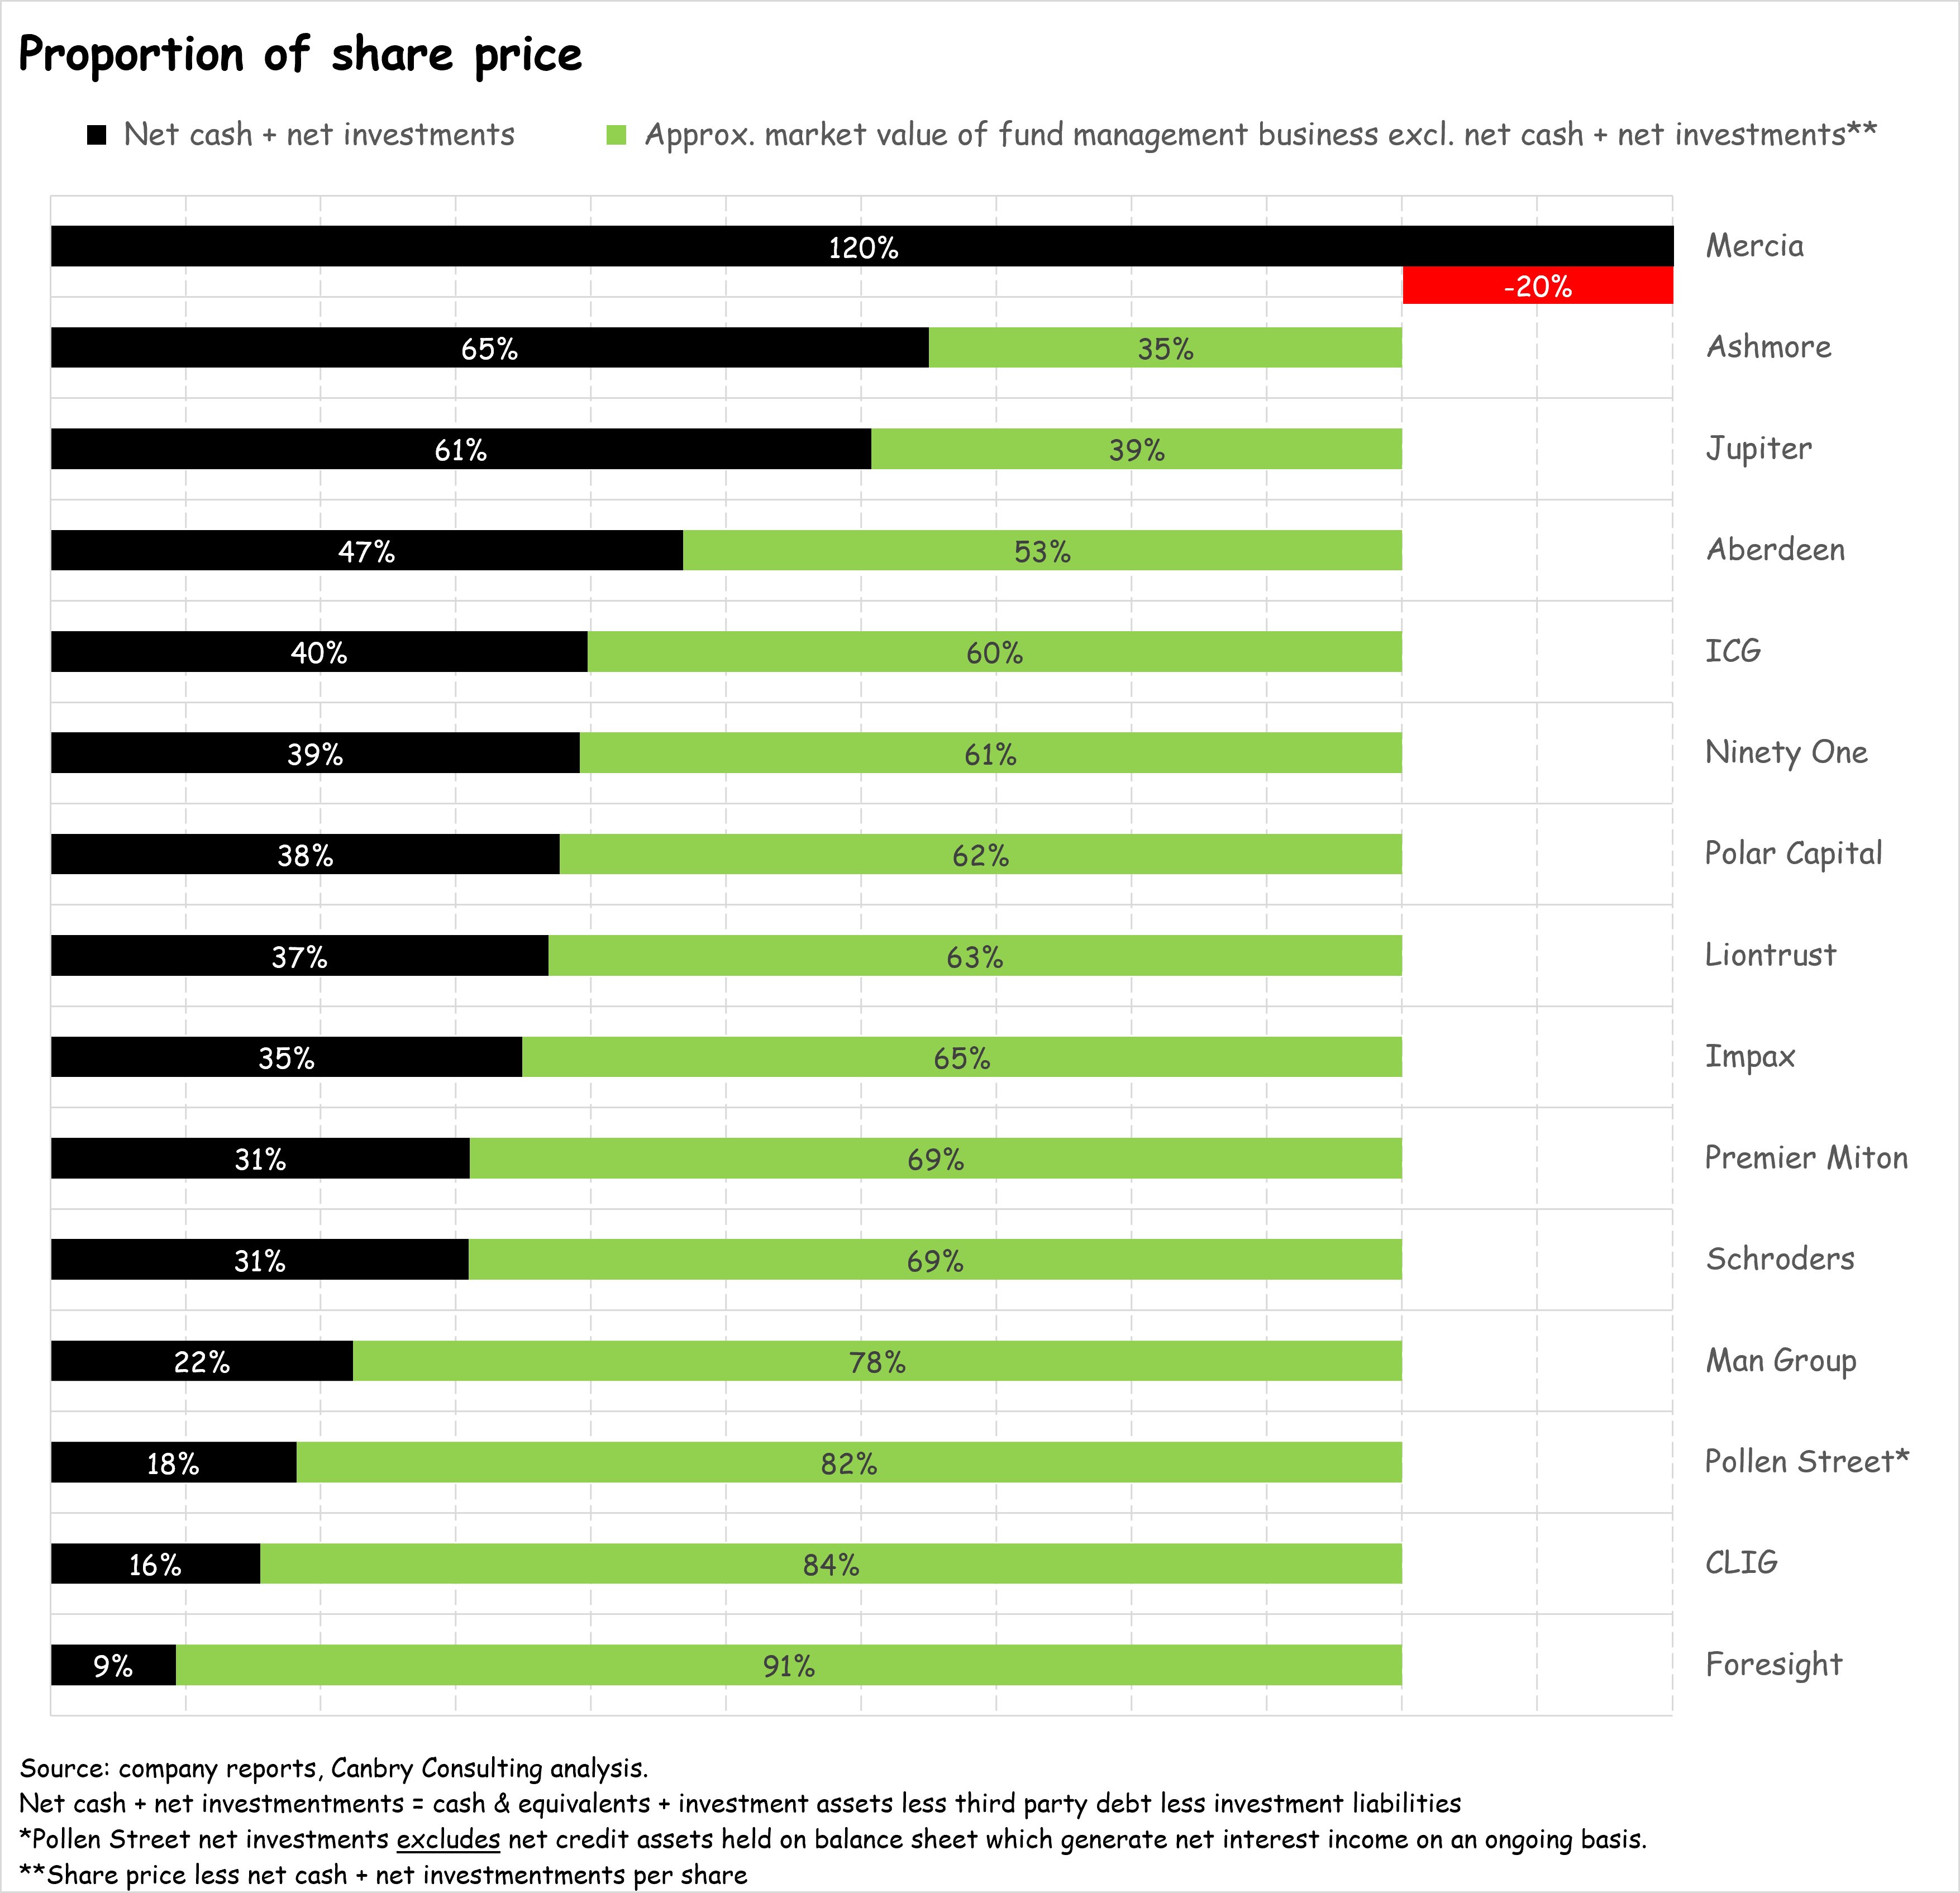
The one obvious anomaly to address in the chart above relates to Mercia. How can the value of its fund management business be negative when it is making decent profits (EBITDA margin c22%)? The value is obviously not negative, the market is clearly assigning an enormous discount to the value of its on-balance-sheet investment portfolio, which are mostly high growth earlier-stage equity investments. If you’re interested in digging deeper into this point, see my recent post below.

The other point to highlight in the chart above is the strength of some of these balance sheets. Ashmore and Jupiter’s net cash and net investments make up over 60% of their share prices, with a host of others’ cash and investments making up 30% - 50%.
Now, if we strip out the above balance sheet items, we shed a bit more light on the valuation levels of companies’ fund management businesses and investors’ expectations of earnings growth (or lack of expectations?).
I’ve done this by creating a ‘balance-sheet-adjusted PER’, which deducts the net cash and net investments per share from each company’s share price, and then divides that by adjusted earnings per share. On a standalone basis, the absolute values of these PERs are not that useful (as part of these balance sheet items are necessary to generate earnings), but the relative value of these PERs between asset managers is extremely useful. It really does tease out which asset managers’ share prices are baking in earnings growth, or not.
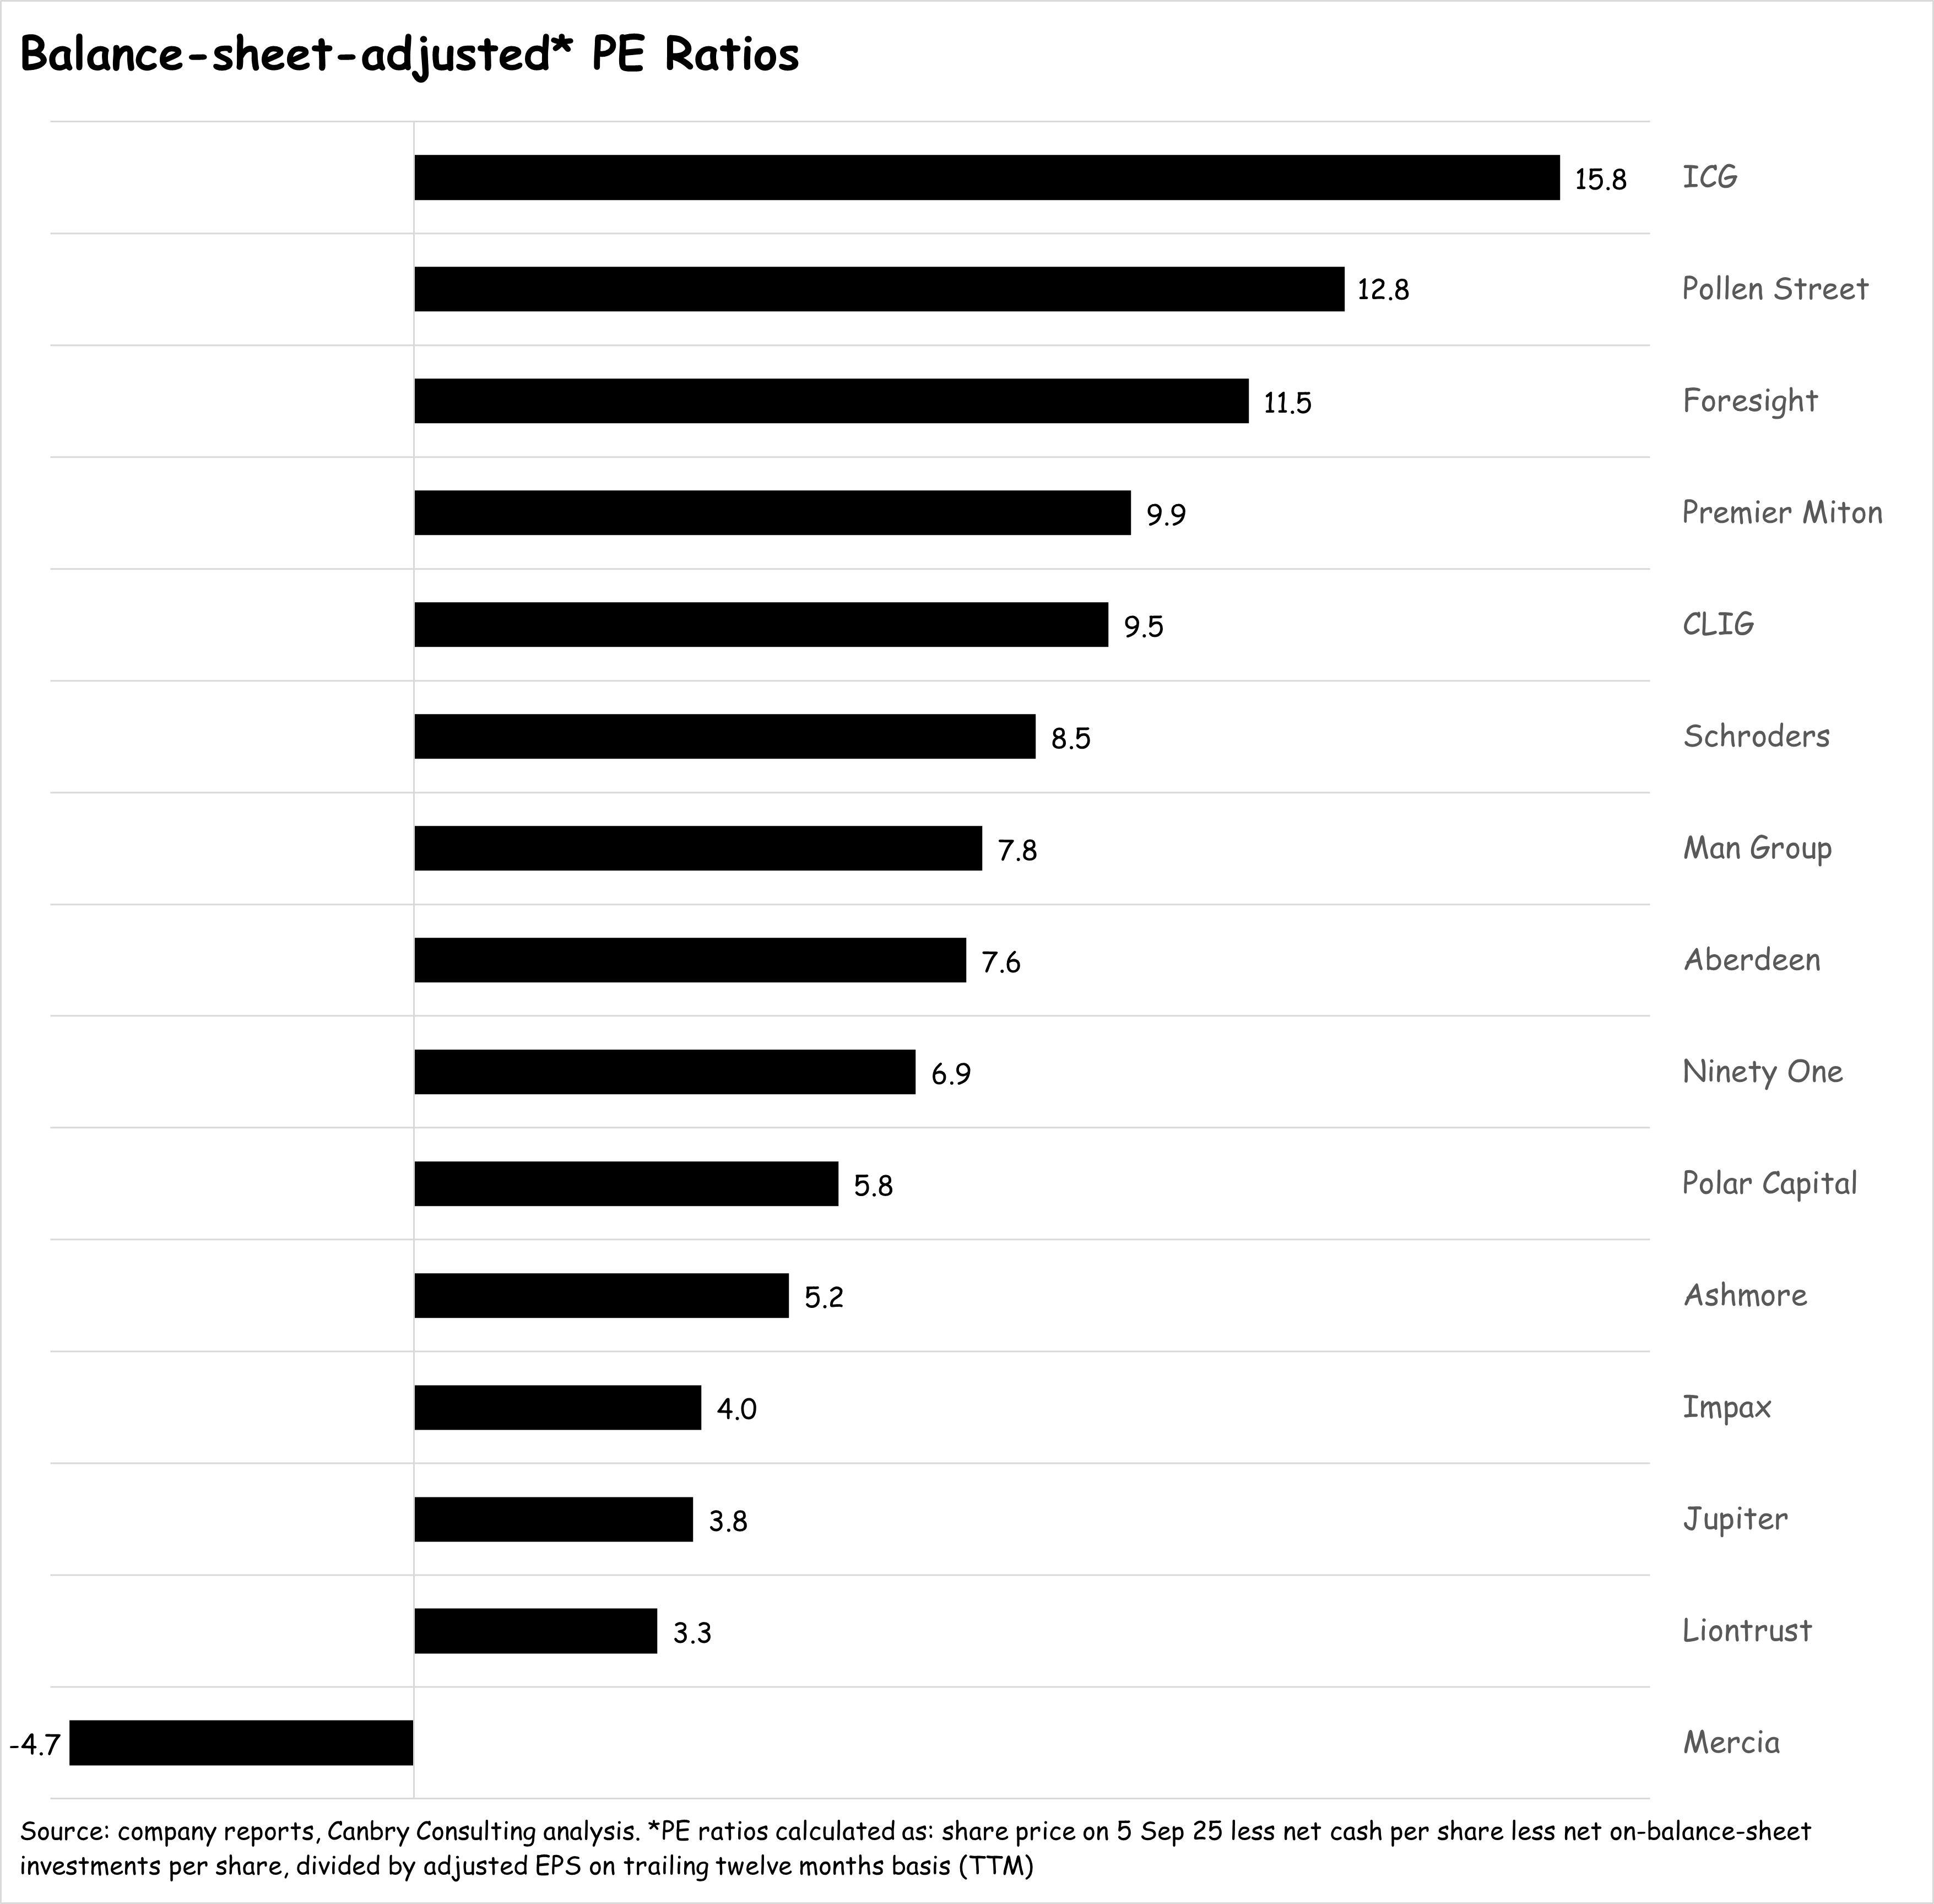
One immediate observation is that the top 3 PERs are held by private markets specialists: ICG, Pollen Street, and Foresight. That’s probably unsurprising given the relatively positive zeitgeist around private assets at the moment. On that point, this article might be of interest: Blackstone ad campaign to target advisors in private markets push.
The Mercia anomaly has already been discussed above.
And Impax, Jupiter and Liontrust appear extremely out of favour at the moment with substantially lower balance-sheet-adjusted PERs compared to peers. In the case of Jupiter, it’s worth mentioning that its low PER remains after a 37% year-to-date share price rise, and that it was one of the few asset managers to record positive net flows in Q2-25. An example of an extreme share price overshoot to the downside a few months ago perhaps?
But let’s run through some of the key issues, company by company, in the context of the above valuation discussion, which investors may want to dig into in a bit more detail when conducting their own research. I’ll cover them in descending order of market cap.
ICG
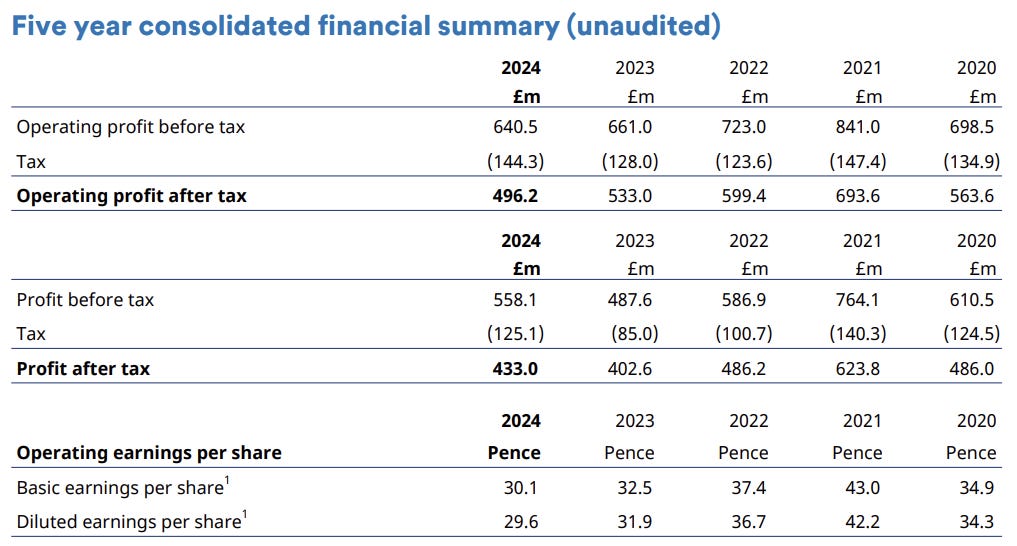
This appears to be a high-quality business with a consistent record of attracting capital for its funds. And just look at the 5Y growth rates of some key metrics below (from latest annual results).
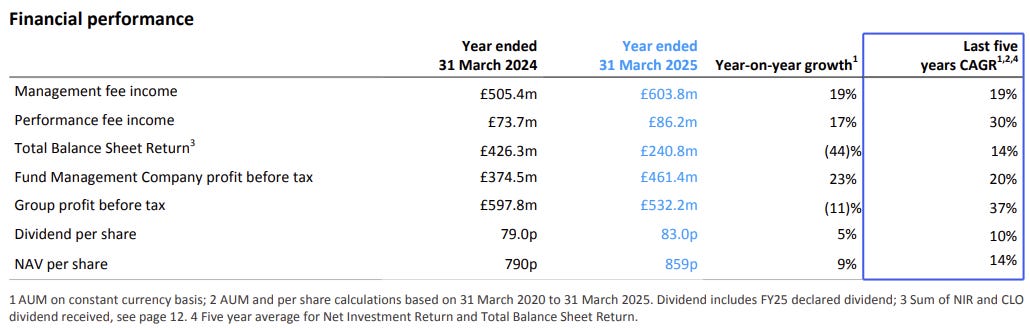
I suppose the key question for investors is if there’s more upside for the share price given that it is already pricing in good growth?
Schroders
A middle-of-the-pack-ish valuation for the largest UK-listed asset manager by AUM (£777bn on 30 Jun 25).
It hasn’t had a great run over the last 5 years with profits declining substantially since 2021.
Looking forward, this is all about delivering on the relative new CEO’s turnaround plan (Richard Oldfield took over in Nov 24).
From Schroders latest interim results:
Strategic intent: returning to profitable growth
In March, we launched an ambitious programme to return the business to profitable growth. We are tightening our focus and resources on our leading investment capabilities, removing duplication and complexity. By scaling our core strengths across Public Markets, Schroders Capital and Wealth Management, we will broaden our reach, drive efficiency and accelerate growth in our focus areas.
We set out a clear plan to that effect, with new ambitious three-year targets. By the end of 2027, we aim to:
– stabilise revenues in Public Markets;
– generate cumulative net new business of £20 billion in Schroders Capital;
– achieve a 5–7% annualised net new business rate in Wealth Management; and
– deliver £150 million of annualised cost savings.
Together, these actions are designed to reduce our adjusted cost:income ratio from 75% at FY 2024 to less than 70% by FY 2027, and return our business to profitable growth.
Our transformation programme has enabled us to reduce operating expenses by £21 million, net of reinvestment, with an upgraded expectation for the full year of c.£50 million in-year savings.
Aberdeen
Another middle-of-the-pack-ish valuation for one of the largest asset managers. It is one of the more complicated to assess though, as it comprises an investments business (AUM £368bn on 30 Jun 25, adjusted operating profit in H1-25 of £35m), the high-flying platform interactive investor (AUMA £85bn, adjusted operating profit £69m), and an adviser business (AUMA £76bn, adjusted operating profit £42m).
Like Schroders, it also has a relatively new CEO (Jason Windsor, appointed Sep 24). And it is in the midst of a major transformation in the post-Abrdn era, the success of which is likely to be crucial to shareholder returns. There’s a heavy emphasis on cost savings. An extract from the latest interim results reads:
Update on transformation programme
As at the end of H1 2025, the transformation programme had delivered £137m of run rate cost savings, the majority of which benefit the Investments business. We remain on track to deliver the target of at least £150m of cost savings on an annualised basis by the end of 2025.
Our transformation programme is about more than just cost reduction; it is also designed to deliver improved outcomes for our clients and colleagues, and set up Aberdeen for the future. Under the leadership of Richard Wilson (Group COO and ii CEO), we are starting to deliver improved operational efficiency, simpler processes, better operating models, greater automation and smarter use of technology and AI.
This is one that requires some deep digging by potential investors to assess upside potential.
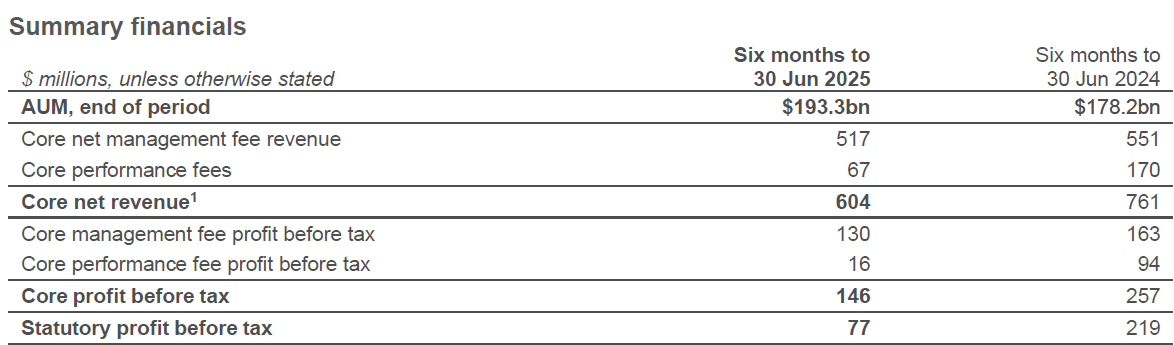
Man Group
One of the more differentiated asset managers in this peer group with a ‘quant’ emphasis and on using technology in its investment process.
It’s a strong performer and has been one of the leaders in attracting and retaining client assets over the last few years - so it’s clearly got a quality offering.
But investors do need a stomach for earnings volatility because performance fees are core to its business model - and these can fluctuate - a lot!
The share price took a beating following weak-ish but hardly disastrous H1-25 results (mainly a big drop in performance fees), with the share price only just above the lowest levels since 2021.
This isn’t a simple business for investors to analyse but at this valuation level, I’d definitely put it in the ‘need to have a more detailed look’ category.
Ninety One
Quite a different client profile for this asset manager (whose origins are in South Africa) with 43% of AUM sourced from clients in Africa, 18% APAC and Middle East and only 16% from the UK (the balance from the Americas and Europe). It also has quite a broad range of fund offerings including global equities, EM equities, fixed income, multi-asset, and it has a South African Fund platform.
In its results for the year ending 31 Mar 25, it commented:
This was a year of two halves. The second half of the year reflected a turnaround with net inflows of £0.4 billion, our first positive net flow half-year in two years. This followed a tough first half, to end on net outflows of £4.9 billion for the full year… In the first half, risk aversion persisted toward public markets and emerging assets. Clients rebalanced portfolios and reduced cyclical exposures, resulting in £5.3 billion of net outflows. In the second half, clients re-engaged across several of our core strategies, and flows responded… Overall, client activity improved steadily throughout the year. The inflection in flows mid-year supports our belief that clients are beginning to re-risk selectively and that demand is returning for differentiated active strategies. Nevertheless, competition for client capital is as intense as ever
An important part of assessing this manager is its deal with South African financials giant Sanlam, which should add £15bn to Ninety One’s AUM of c. £140bn on 30 Jun 25 (c. £2bn already transferred). It should also add substantially to Ninety One’s distribution channels.
It looks to be conservatively valued but needs a detailed assessment by investors to fully understand all the moving parts which will affect Ninety One’s future.
Ashmore
It’s been an awful few years for this emerging markets fixed income specialist (with a growing EM equity offering now making up 16% of its US$48bn AUM). In 2021 AUM was over $90bn!
In 2022 it was hit by heavy falls in the value of its portfolio, from negative market moves in the EM space and from investors withdrawing capital. To be fair, it’s delivered strong returns since early-23, but net flows have not followed. They have been negative in every quarter over that period. Turning that around is obviously the key to Ashmore’s fortunes.
It has a very strong balance sheet with cash and investments making up around 65% of the share price, and a very low-looking valuation. But it simply has to get back to positive net flows.
In its latest results, the CEO stated:
Ashmore's active investment processes are delivering outperformance for clients against a positive backdrop for emerging markets, and its distribution team is active around the world with both existing clients and potential investors, emphasising the need to deploy more capital to capture the favourable trends evident across emerging markets. Ashmore is therefore well-positioned to capture flows as investors shift allocations away from the US, including to the emerging markets that offer superior growth and higher risk-adjusted returns over the medium term.
But that message has been around for some time now, and flows haven’t turned the corner yet.
Jupiter
Mathew Beesley, appointed CEO in late-2022, took on a tough job. Jupiter’s cost base was too high and there were too many sub-scale funds. Early in his tenure, AUM received repeated hits from heavy and sometimes lumpy outflows (from the retail channel, the deal with Chrysalis, and star fund managers leaving).
So, a huge part of his first few years was to ‘stop the bleeding’ of AUM and to trim the cost base. It looks like he’s winning.
On costs, the 2024 results stated:
Over the last few years, we have had a particular focus on cost discipline. We announced £20 million of annualised savings in 2022. We delivered lower costs again in 2023, and whilst costs are slightly up this year, we have managed below the guidance we provided at the beginning of the year.
And a May 25 announcement stated:
We have identified further opportunities to deliver cost efficiencies. The initial target is £15m annualised savings, which will be fully implemented on a run rate basis no later than the end of 2026. These annualised savings are in addition to the cost savings already achieved within the management expectations previously provided for 2025, and are one of a number of actions we are taking towards achieving our medium-term target of a 70% cost:income ratio.
On the AUM front Jupiter returned to positive net flows in Q2-25 (which was better than most asset managers), and the focus of delivery seems to be shifting to new growth initiatives, such as additional systematic investment offerings, new active ETF offerings, and a very well received acquisition (announced Jul 25) of CCLA Investment Management which specialises in the charity sector.
The acquisition should add £15bn to Jupiter’s Jun-25 £51bn AUM base. And at a price tag of £100m (funded entirely from cash) for £13m of ‘underlying operating earnings’, it looks like a sensible price. The announcement also put a number to the cost synergies thought to be achievable: £16m per annum by 2027. Good to be specific on that!
Even though Jupiter’s share price has jumped, it still looks very lowly rated, so this is definitely another one to put in the ‘need to have a more detailed look’ category.
Pollen Street
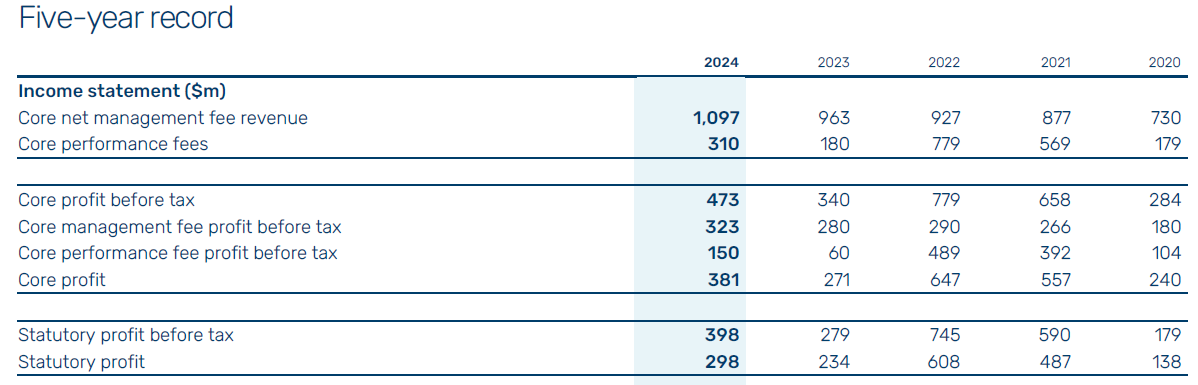
This private assets specialist is clearly a really strong performer. From its latest annual report:
From a shareholders' perspective, probably the trickiest issue to get a handle on is valuation. Pollen Street has a big balance sheet. It runs a large revenue-generating on-balance-sheet credit portfolio (>£300m), and has almost £200m invested in its equity and credit funds. And its income statement is going to be inherently ‘lumpy’ with fair value adjustments of investments, realisations of investments, and performance-related fees.
The share price has had a strong run but even after this, doesn’t appear excessive at first glance. For any investor looking into this sector, this one is worth a detailed look.
Foresight
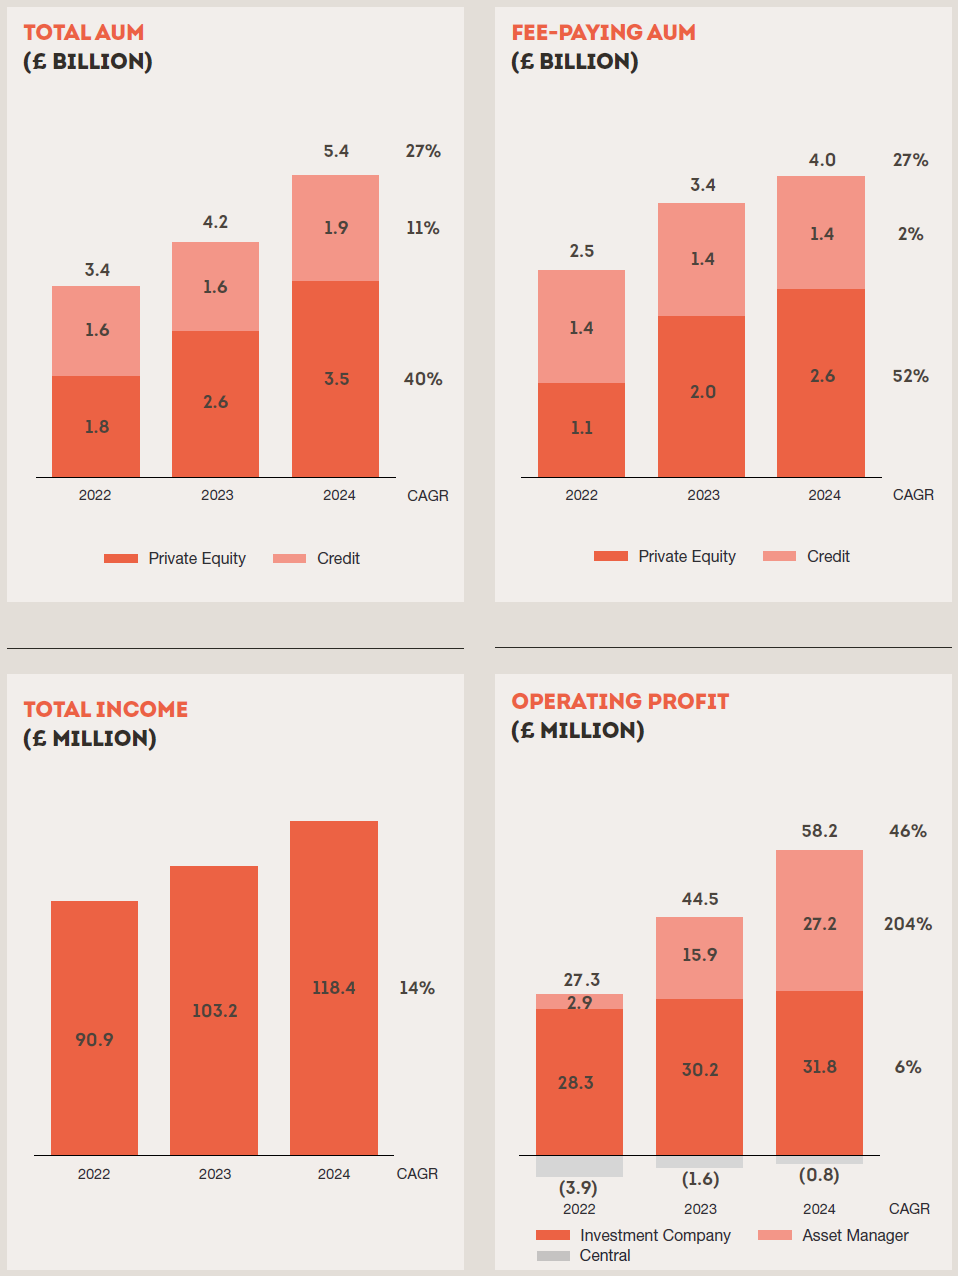
Another private-markets specialist, mostly in ‘real assets’, predominantly energy and transport infrastructure. Strong overall growth since IPO in 2021 but this has slowed.
Profit margins are strong but not expanding. I recon shareholders will be looking for another step up in the growth trajectory.
Polar Capital
A multi-boutique manager with a large technology exposure, over 40% of AUM, so it is more exposed to the fortunes of the tech sector than most.
It’s clearly a strong business with some of the strongest net flows in recent periods, and very strong profit margins. See my research note Core profits exceed forecast, AUM +6% in Q1’26 covering its latest financial year for more details on this. Valuation certainly looks low given the strength of its balance sheet.
I suspect investors will now be watching for any changes in strategy and performance when current CEO Gavin Rochussen retires in Sep 25 and Iain Evans takes over. Evans has been Global Head of Distribution for some time now so should be exceptionally well tuned-in to client preferences (Polar mostly targets institutional investors).
Impax
For this sustainable investing specialist, it’s also all about returning to positive net flows after a period of heavy outflows. Its share price has been badly beaten up. I think excessively so as detailed in my recent research note: Tough H1, but shares detached from fundamentals.
With a strong balance sheet, still-decent profit margins, a trimmed-down cost base and a highly-differentiated offering, if it does return to solid net inflows, Impax could re-rate dramatically.
And this isn’t about the ESG-bandwagon. As CEO Ian Simm stresses:
Impax’s investment thesis is based on the insight that the transition to a more sustainable economy is both highly likely, as individuals and businesses prefer more efficient, less damaging goods and services, and also replete with investment opportunities, particularly due to the mispricing that often accompanies significant market developments in this area… although many of the investment strategies that we manage lagged generic benchmarks during 2023 and 2024, there are strong signs that this period is behind us and that our investment focus can once again deliver attractive returns.
Liontrust
Another asset manager where it’s all about whether it can return to net inflows after a prolonged period of heavy outflows. AUM is down from c. £37bn at the end of 2021 to £22.6bn at the end of Jun 25.
Liontrust has a heavy skew towards a UK retail investor client base, which have mostly been withdrawing from active equity funds for some time now. If it can turn the net flow situation around, it’s very low valuation could re-rate.
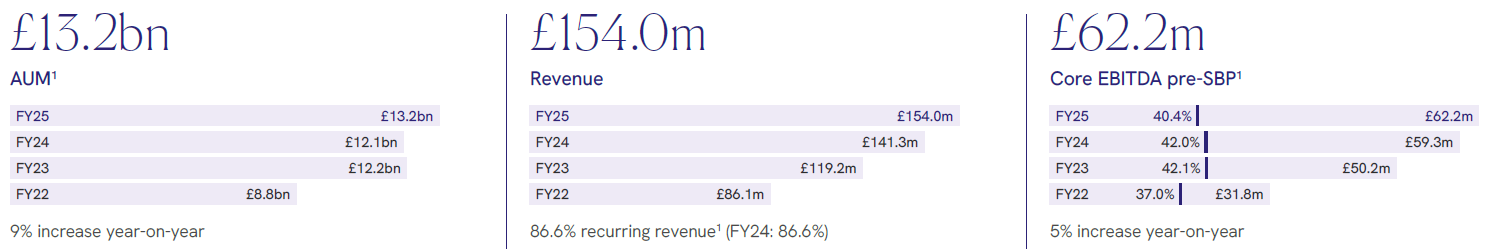
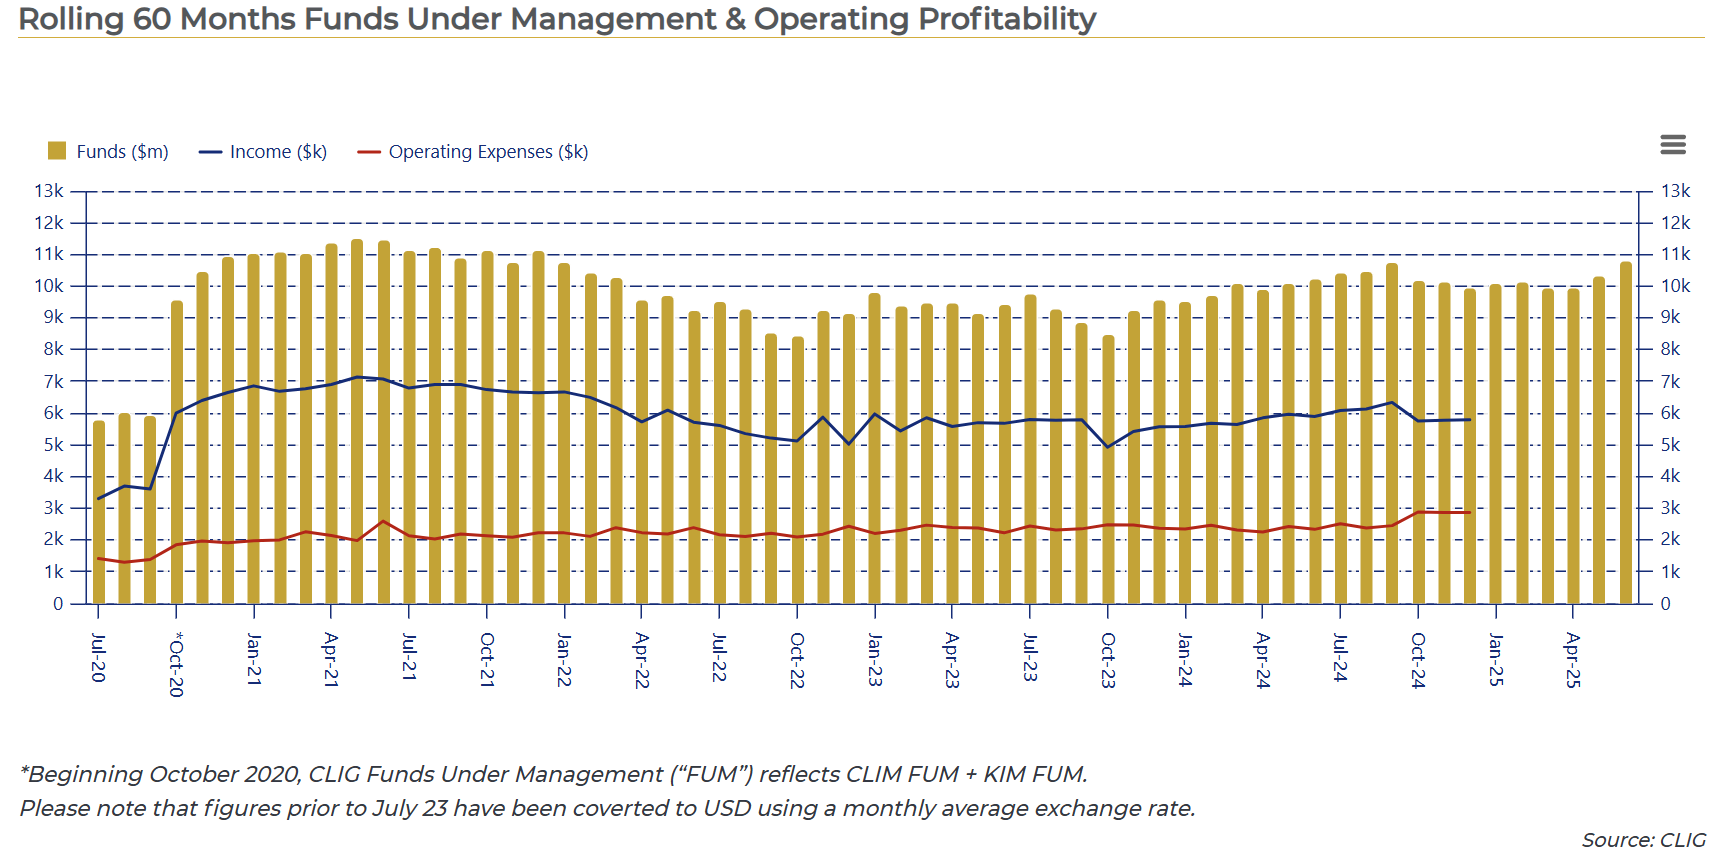
City of London Investment Group
A small, specialist player with AUM of US$10.8bn (30 Jun 25) which invests in closed-end funds and investment trusts. Recent communications have emphasised the opportunity from discounts to NAV narrowing in its underlying investments. That may very well be an opportunity, but I think management does need to focus on growing this business to have any substantial impact on its valuation. Chart below from CLIG website.
Premier Miton
The smallest asset manager in this group by market cap (just under £100m at the date of publication) with £10.5bn AUM. Flows have been negative in recent periods but not too bad compared to some other asset managers in this group.
Its UK equities offerings are quite high profile, but it actually has a fairly diversified AUM portfolio (UK equities 17% of AUM, International equities 27%, Multi-asset 26%, Fixed Income 21% and Absolute Return 9%). Absolute Return strategies have had a good run of positive net flows recently.
Management are fairly positive on prospects of a return to positive net flows:
In the wake of recent market volatility, there has been a notable shift in market leadership, creating a fertile ground for active equity managers to demonstrate their prowess. This dynamic environment offers opportunities to capitalise on emerging trends and sectors, highlighting the value of strategic stock selection and agile portfolio management.
There were encouraging signs of progress during the Quarter (to 30 Jun 25) despite reporting a net outflow overall. Demand for our absolute return and fixed income funds remained good… net outflows from our UK equity funds reduced by over 50% compared to the average of the previous four quarters, reflecting improving investor sentiment and solid fund performance… European equity strategy recorded further net outflows of £132 million, this occurred alongside a strong period of performance, with the fund ranking second out of 130 in its sector over the Period. We believe that this positive performance will begin to translate into improved flow dynamics over the coming quarters…Shortly after the Period end, on 7 July 2025, we successfully onboarded a new institutional absolute return mandate seeded with $50 million. In parallel, we are advancing discussions on an additional institutional mandate, which we are seeking to finalise before year-end.”
As already mentioned, it is acquisitive (Tellworth was acquired in early-24, adding just over £0.5bn AUM, it looked at acquiring River and Mercantile in 2021 but that wasn’t concluded, and management have expressed an appetite for further acquisitions). Acquisition accounting does skew statutory accounts, so investors need to dig into the numbers in some detail.
It is undergoing a cost cutting exercise. That’s needed as margins need to improve. An adjusted operating margin in the high teens is low for an asset manager. It also needs to scale as identified by management. This might even be an acquisition target for someone else?
Be sure to subscribe to TheInvestors.blog below to keep up to date with the UK asset and wealth management sectors.
And if you think TheInvestors.blog is worth telling others about and sharing, I’d be most grateful if you do.
Disclosure: At the time of writing, Paul Bryant was a shareholder in a number of the companies mentioned in this publication, and covered Impax Asset Management, Polar Capital, and Mercia Asset Management, as an analyst on behalf of Equity Development Limited. Read Equity Development’s research on these companies by clicking on each. And please read this link for the terms and conditions of reading Equity Development’s research.
best analysis of asset management stocks.
thank you
Belter of a trading update from Man Group this morning (17 Oct 25). AUM up 11% in Q3 but most impressive are +$9.7bn of net flows (5% of AUM) https://www.londonstockexchange.com/news-article/EMG/trading-statement-q3-2025/17283041