

This is the second of a two-part post on Premier Miton (PMI). The first was a profile and detailed look into recent performance. This post follows on from that and takes a look at valuation and how it compares to the share price. I’d suggest reading the first post (link below) before this one - for context.

The UK Asset & Wealth Management newsletter and website is not investment advice. Please read the disclaimer here.
The fall in Premier Miton’s fortunes is down to one thing. Fund investors withdrawing money. That is ultimately responsible for the fall in AUM, revenue, profits, and the share price. It’s been unrelenting since the end of 2021.
AUM & net flows by quarter: historical
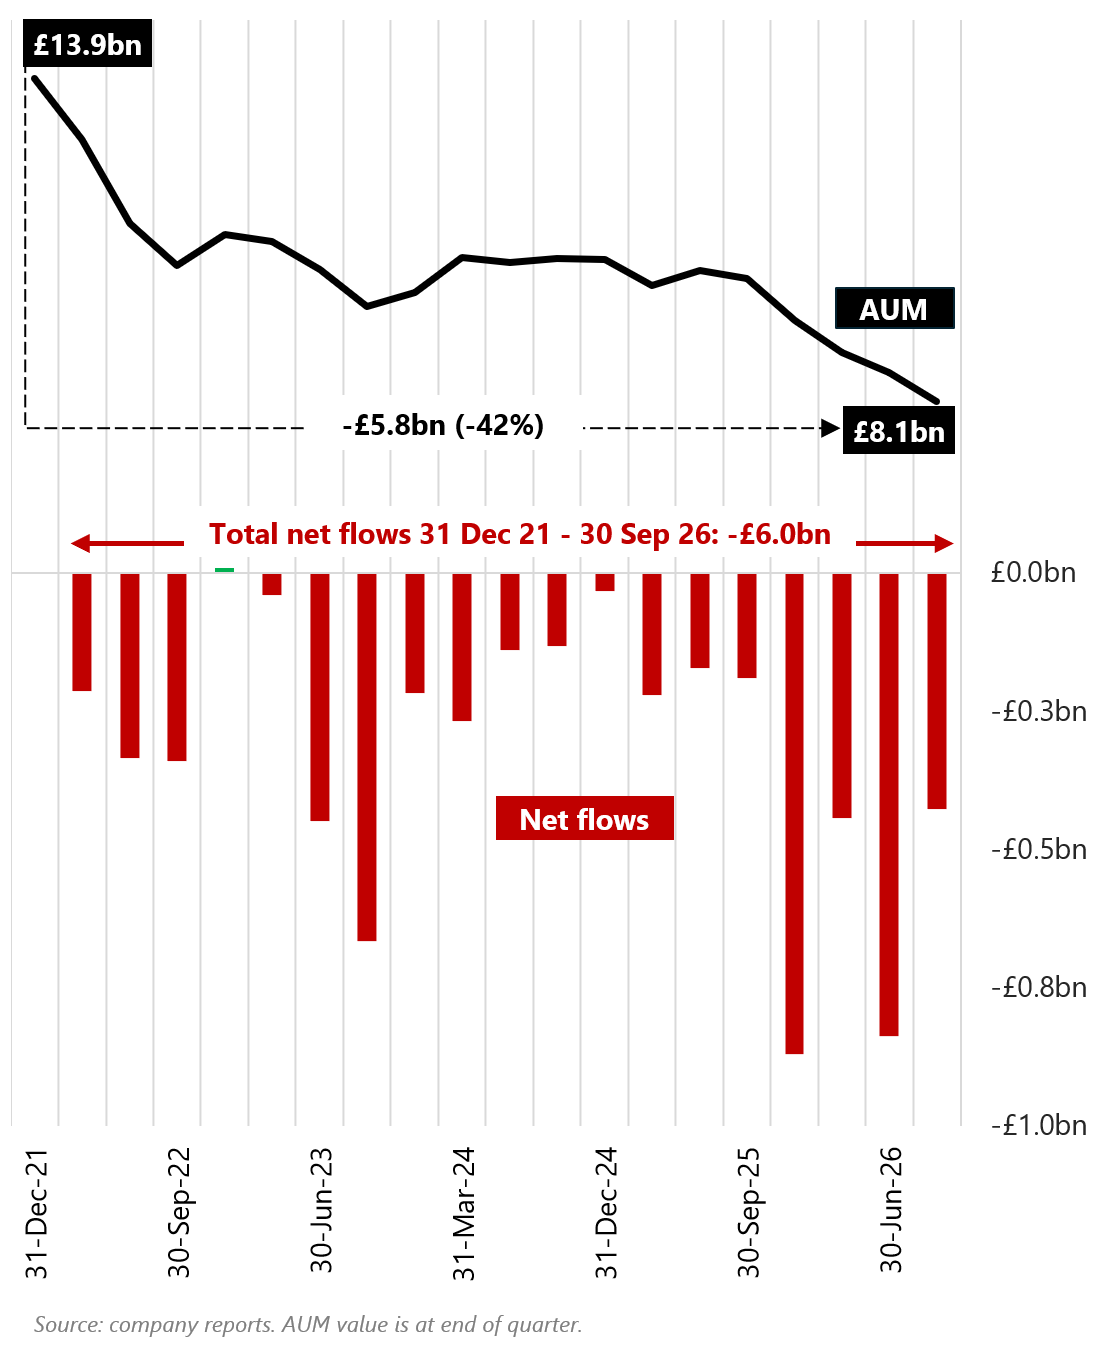
In part 1, I showed that the underlying driver of most of the recent outflows were PMI’s equity strategies, and especially its international equities strategies. In contrast, fixed income has seen good client demand with a run of positive net flows. Multi-asset strategies have also seen net outflows, but nothing like the scale of equities outflows. Absolute return strategies’ flows were strong in 2025, but very grim in 2026.
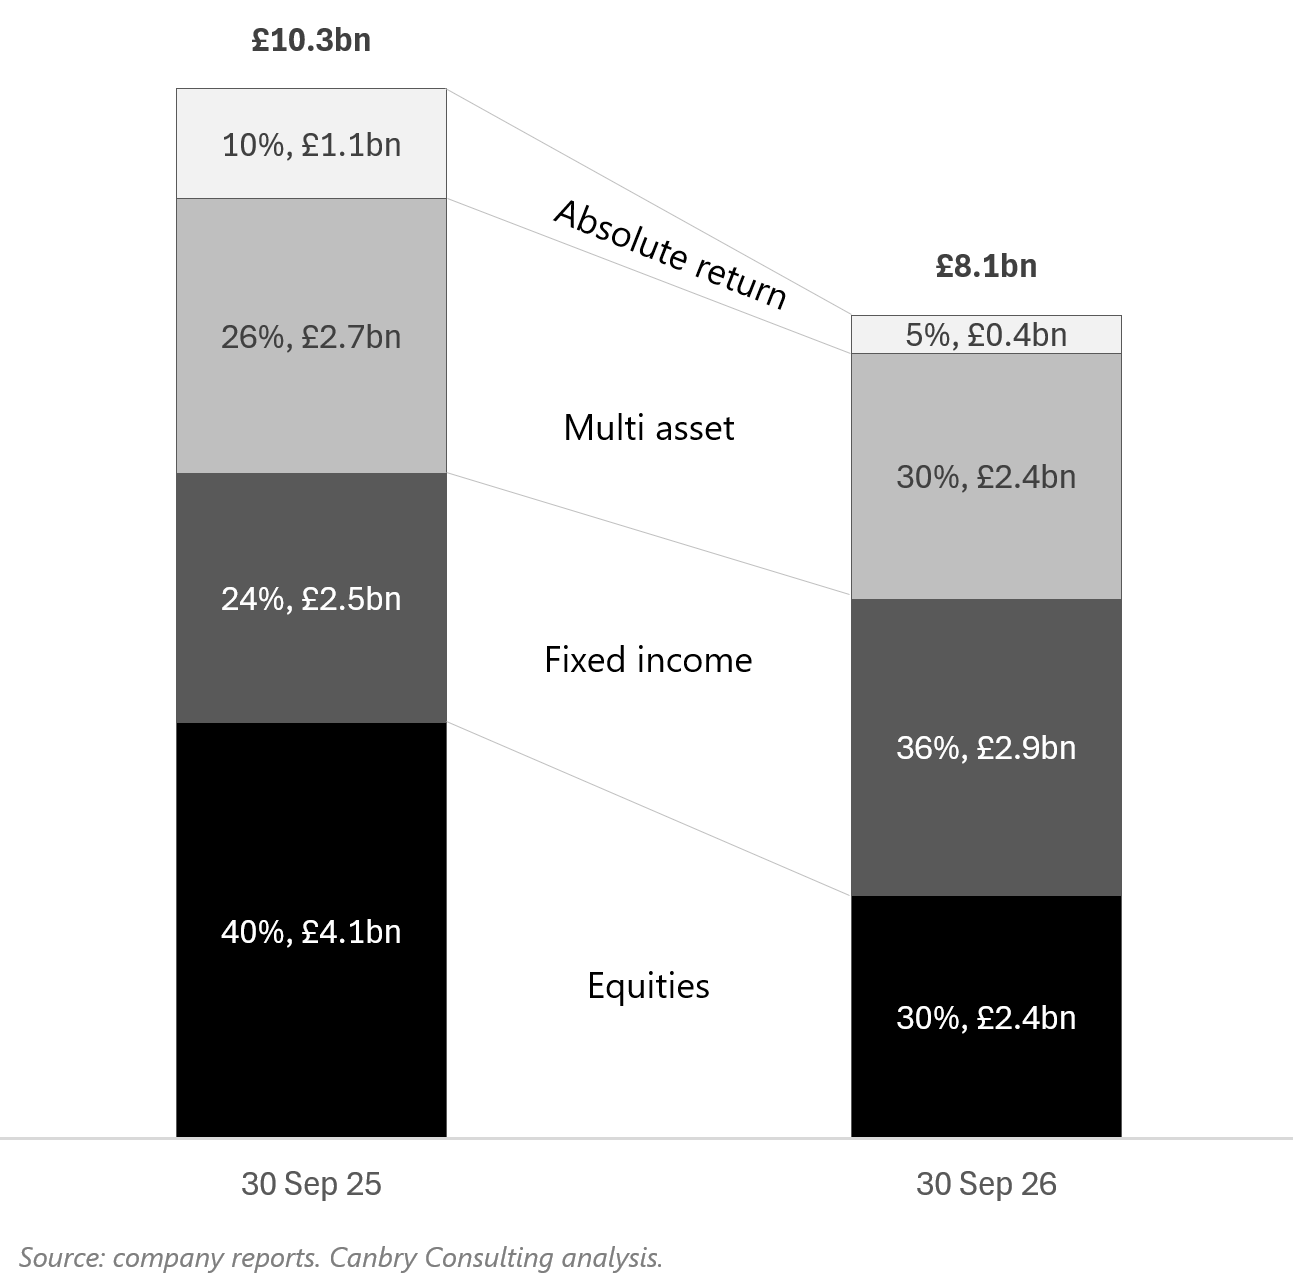
The differing fortunes of PMI’s strategies over FY26 have been so extreme, the product mix now looks quite different to one year ago. Fixed income is now PMI’s largest asset class, by some distance.
Product mix movement over FY26 (AUM)
The prospects of PMI are now highly uncertain, but not that complicated. It simply has to:
Turn around the fortunes of equities strategies - this needs to be driven by a turnaround in lagging investment performance, where management’s primary action has been to appoint new heads of these strategies.
Concurrently, build on existing net flow momentum in fixed income and improve flows in multi-asset - PMI reckons it is well positioned to achieve this with such strong demand in the UK for income-generating products (ageing population), and because of its strong distribution base in the IFA and wealth manager space.
I reckon there’s a strong case to be made that PMI could do relatively well in the fixed income and multi-asset space. Management’s argument is solid, so it’s about good execution.
Whether it can turn its equities fortunes around is a different matter. It’s just so uncertain as to whether the new strategy heads can indeed turn around the performance lag, and even if they do, will this lead to a big turnaround in flows? It’s impossible to say. And it really does need to be a big turnaround.
I was going to approach valuation by outlining two scenarios, a bull and a bear case. But, for reasons that will become clear, I don’t think there’s any need for that. Looking at a bull case scenario tells me all I need to know.
Bull case
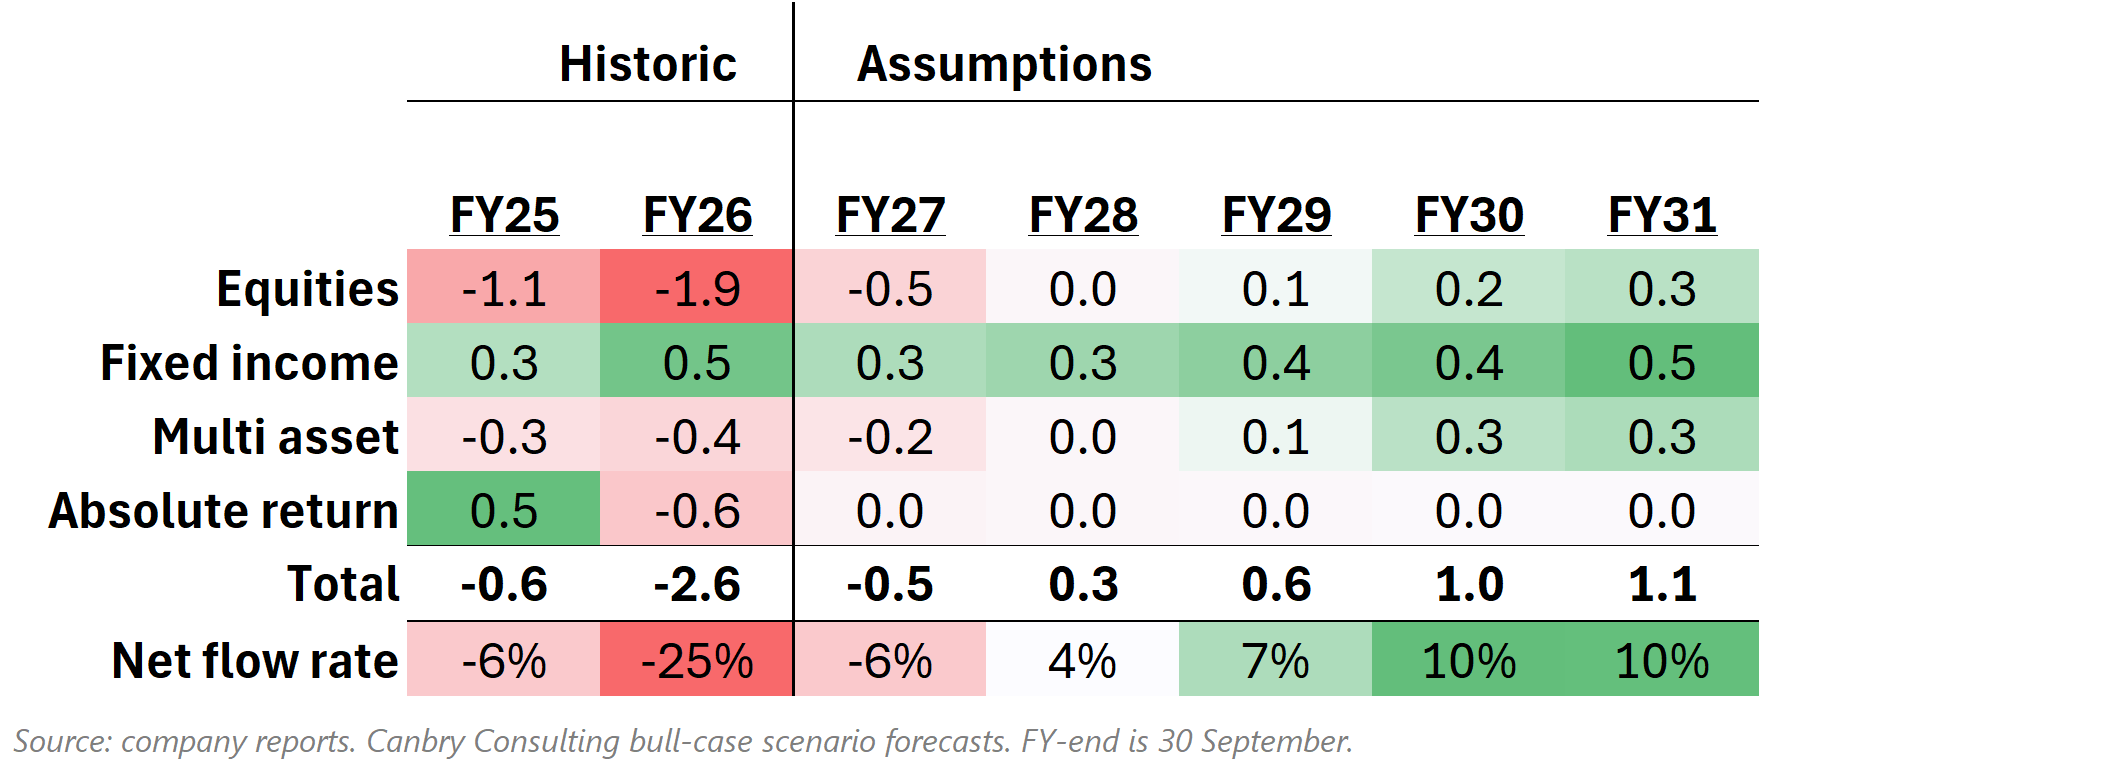
The bull case will assume turnaround success in equities (over a period of time) and solid progress in fixed income and multi-asset. That net flow turnaround is presented as a heat map below.
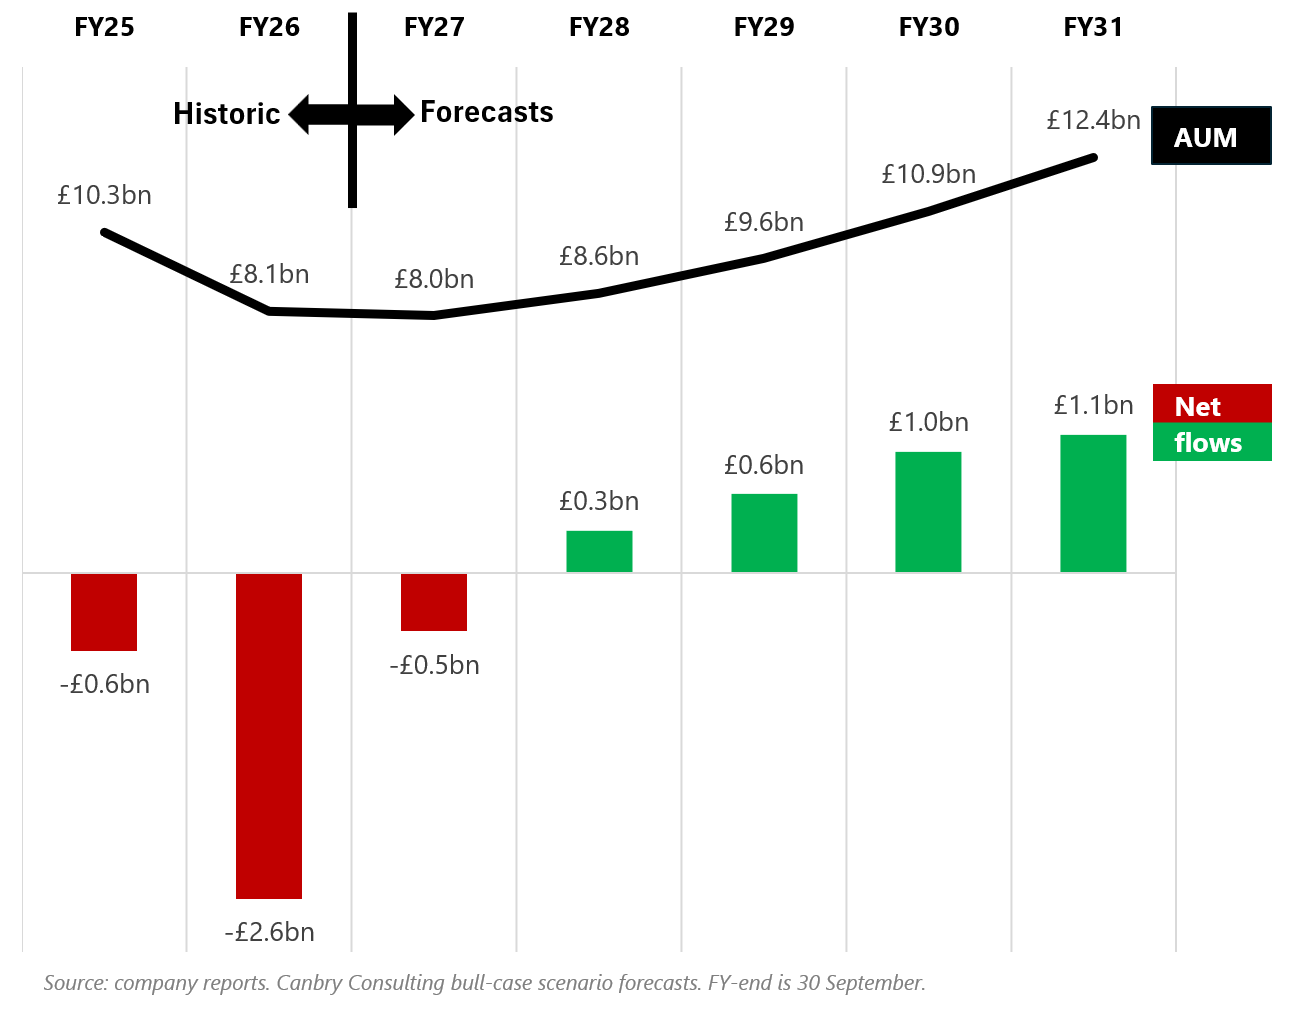
In summary, I’m assuming a move in net flows from -£2.6bn in FY26, to positive net flows in FY28, to +£1bn of net inflows by FY30. That’s a tough task. PMI’s maximum net flow rate over the last six years was c. 8% in FY21. But it is now operating off a far smaller AUM base, and these assumptions could pan out with strategic success.
Net flows: recent history & bull-case assumptions
If we assume annual investment returns of +4% (the AUM base is a blend of equities, fixed income and multi-assets), that gives us a bull-case AUM development as follows:
AUM & net flows: recent history & bull-case assumptions
That AUM development translates to a revenue profile as follows:
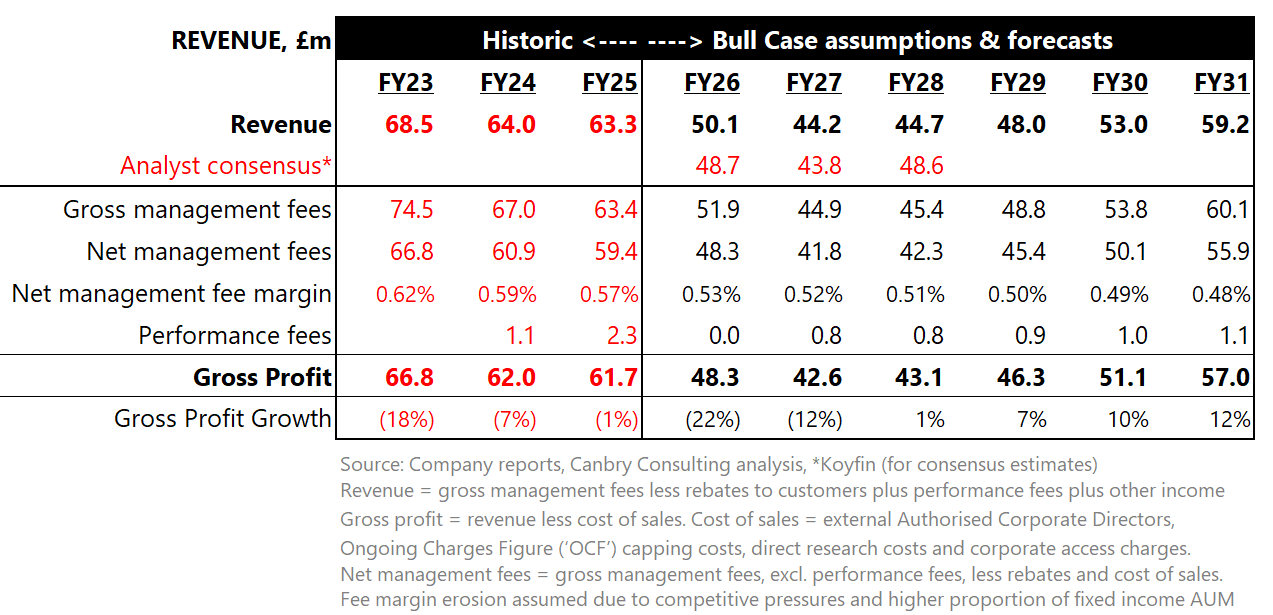
It’s worth flagging that while my bull case FY26 and FY27 estimates are not dramatically different from analyst consensus, 2028 consensus revenue is quite a bit higher than this bull case (£48.6m v £44.7m). So, analysts appear to be factoring in an even stronger recovery than I have assumed. That’s bold.
Now let’s see what costs, profits and cash flows might look like in this bull case scenario.
A key point is that in April 2025, PMI announced the start of a cost-cutting exercise, in response to the AUM fall. There was an initial tranche of £3m in annual cost cuts, then another £2m, then another £2.5m, then most recently in its Oct 26 AUM update, another £1.5m. Management said this last tranche would be implemented over FY27 (Oct 26 - Sep 27).
That’s a total of £9m in annualised cost cuts to be made over 2.5 years between Apr 25 and Sep 27. So, we’d expect the overhead cost base (fixed staff costs plus other overheads i.e. excluding variable pay) to reduce from c. £44m pre-cost cuts (H1-25 fixed costs annualised) to c. £35m in FY28 (the first FY post implementation of the cost cut tranches). But we have to allow for escalation of the remaining cost base too, so assuming existing costs escalate at 4% p.a. from now on (roughly £1.5m p.a.), we get an overhead cost base of c. £38m in FY28.
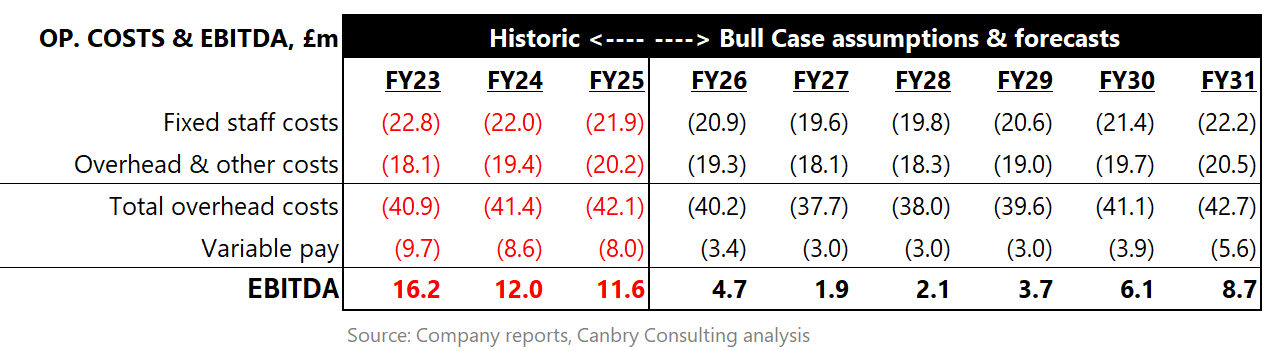
Note: Variable staff pay has historically run at c. 40% of adjusted PBT with variable pay stripped out. I’ve used this ratio as an assumption in forecasts but built in a ‘floor’ of £3m - assuming a minimum level is probably needed for key staff retention.
Adjusting from EBITDA to Free Cash Flow then allows us to complete the bull case DCF valuation, which under current assumptions, produces a per share valuation of c. 32p.
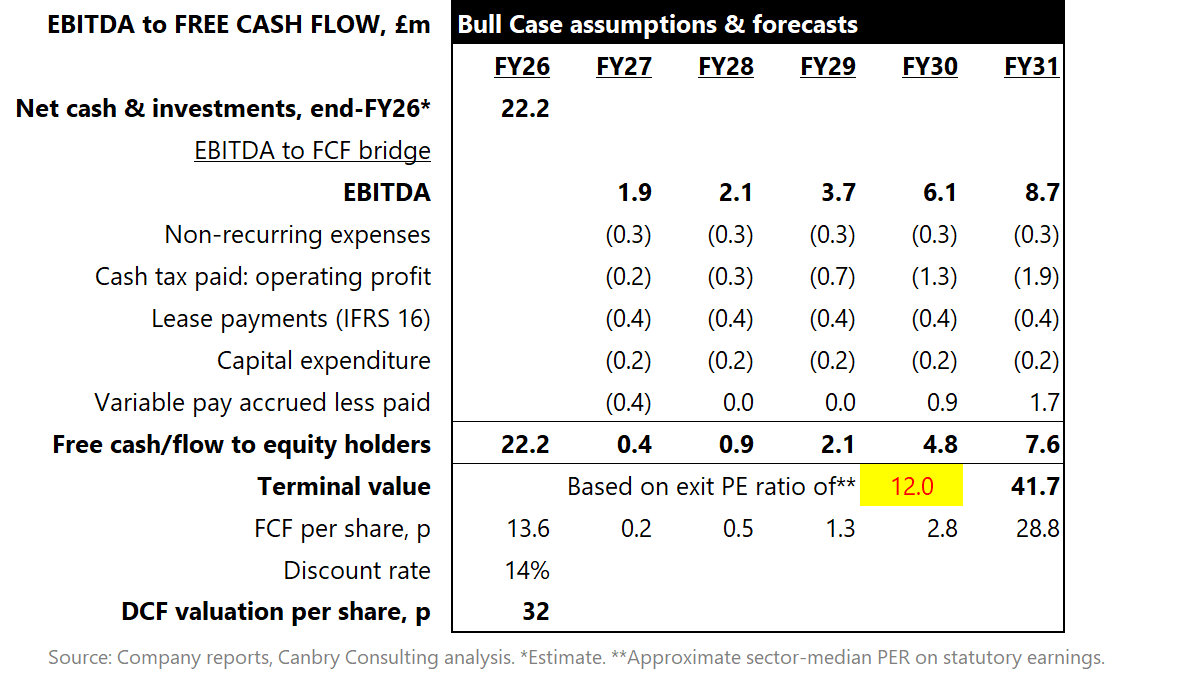
At the time of publication, PMI’s share price was c. 30p. So, the above bull case scenario is nearly fully priced in to the current share price.
It should now be clear why I’m not running a bear case scenario. Any bear case scenario, even a scenario with more conservative assumptions than I’ve made above would suggest a fundamental value below today’s share price.
That’s not saying there might not be a big upside to PMI shares. Management could get the business back to positive net flows quicker than I have assumed; markets could provide a far more powerful tailwind than I have assumed; and you could argue my terminal value is a bit conservative, etc etc. But those are all pretty big calls on top of a bull-case scenario.
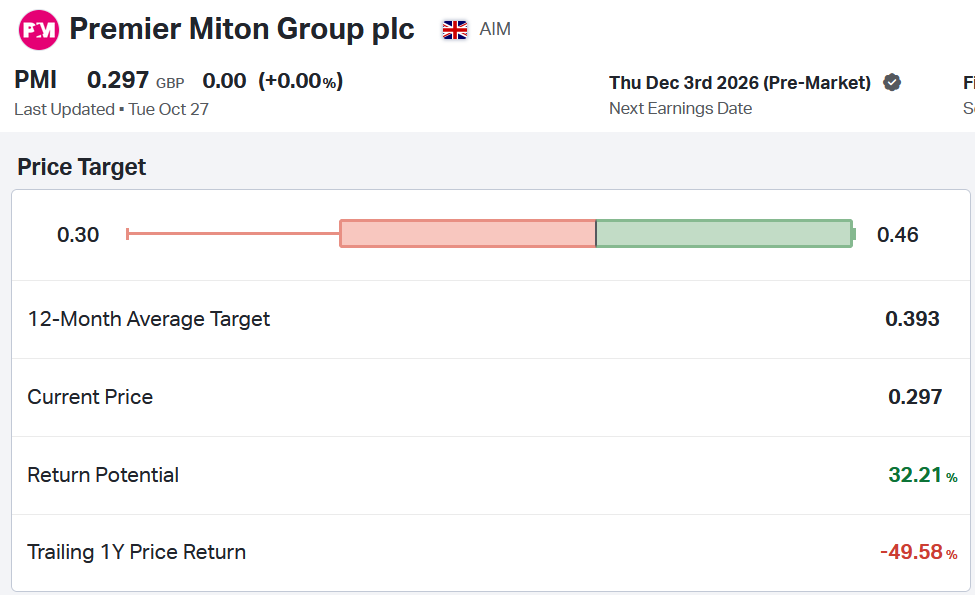
Most covering analysts seem prepared to make those calls. The Koyfin platform provides price targets from 6 analysts, which range from 30p to 46p.
PMI reports FY26 results on the 3rd of December. That will give us some additional short-term data to refine the above valuation, including current cash position, progress with cost cuts, and perhaps a further AUM update.
I’ll update the above forecasts and valuation at that time.
The above is for informational purposes only. This post, and the UK Asset & Wealth Management newsletter and website more generally is not investment advice. Please read the disclaimer here.
The above is part of a series of profiles and valuations of London-listed asset managers. Next up will be Jupiter Fund Management, which has been a very strong performer recently. This will be published in a couple of weeks.
Subscribe to UK Asset & Wealth Management to receive the rest of this series and to keep up to date with the UK asset and wealth management sectors.
And if you think UK Asset & Wealth Management is worth telling others about and sharing, I’d be most grateful if you do.
Disclosure: Paul Bryant may own shares in companies mentioned in this publication. He covers Impax Asset Management and Polar Capital as an analyst on behalf of Equity Development Limited. Read Equity Development’s research on these companies by clicking on each. And please read this link for the terms and conditions of reading Equity Development’s research.