Will the real PE ratio please stand up? (part 2 of 2)
That's me! I'm the 'U-PER'. Asset managers' on-balance-sheet investments, cash piles, and acquisition accounting mean not all PE ratios are created equal. The U-PER might be the most useful.

This is not investment advice. Please read TheInvestors.blog disclaimer here.
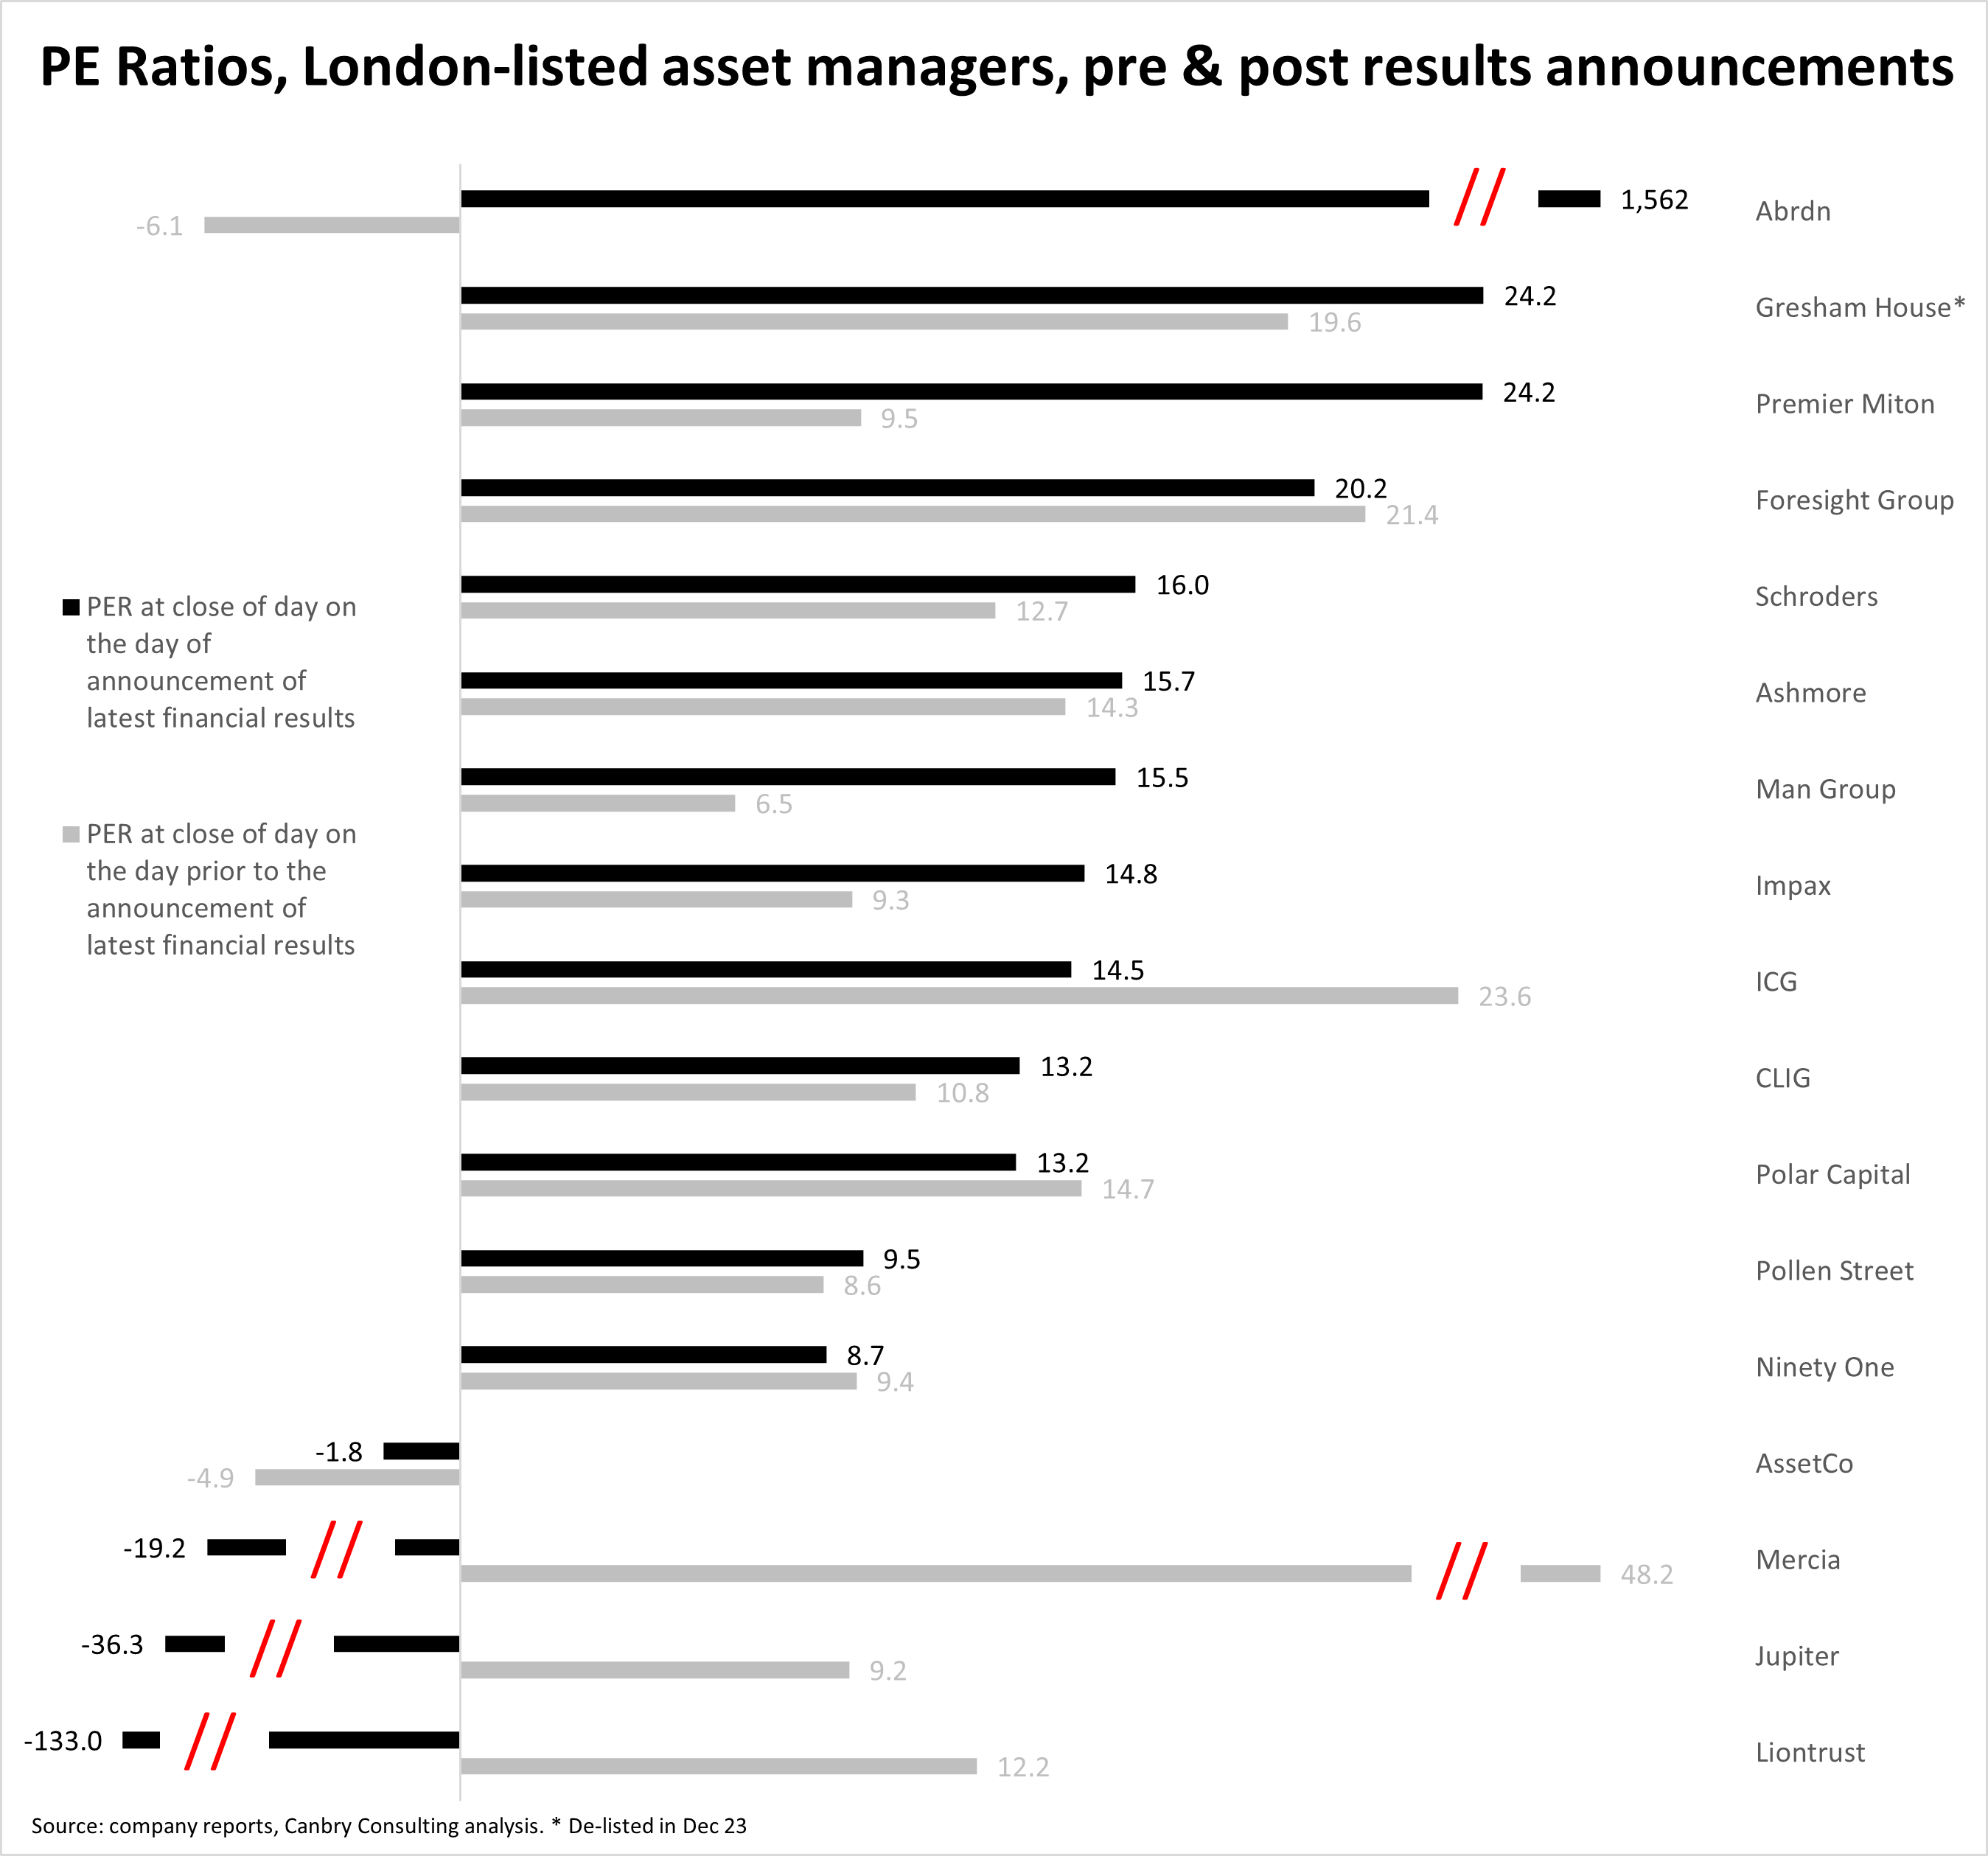
In part one of this post, Lies, damned lies and PE Ratios, I showed how PE ratios (PERs) in the asset management sector can get extremely distorted at times, and be volatile, diminishing the usefulness and credibility of the metric, especially when it is calculated using statutory (IFRS) earnings.

But I also suggested there is a way to modify the PER to get a much better comparative valuation of asset managers’ underlying businesses. And when combined with some fairly straightforward balance sheet analysis, the usefulness of PER analysis ratchets up again.
Let’s look at these balance sheet effects first, then the modified PER.
Without the Balance Sheet you’re flying blind
Some asset managers (AMs) have huge piles of cash on the balance sheet, and most have little or no debt. They are subject to minimum regulatory capital requirements, but some AMs’ net cash balances exceed these levels - by a lot.
Take Ashmore as an example. From their 2023 annual report...
The level of capital required to support the Group’s activities, including its regulatory requirements, is £80.6 million. As at 30 June 2023, the Group had total capital resources of £704.8 million… representing an excess of £624.2 million over the Board’s level of required capital.
Cash and equivalents of £479m made up most of this surplus. On a per-share basis, that level of cash made up 41% of the share price on 16 Jul 24.
Others run with much less cash. Take Foresight Group. Its net cash per share made up around 7% of the share price on 16 Jul 24, while still maintaining a regulatory capital surplus of £6m over its required £17m (2024 annual report).
With such huge differences in cash levels, comparing the PE multiple of a cash-rich AM to that of a relatively cash-lean AM makes little sense without adjusting for the cash levels on the balance sheet.
Also, some AMs have significant investments on their balance sheet, often made alongside the capital they invest for clients. AM’s use their own capital to seed new funds, and a core part of some business models is to run on-balance-sheet investment portfolios (Mercia, Pollen Street, and ICG would be examples).
Indeed, Mercia and Pollen Street’s net on-balance-sheet investments made up more than 70% of their share prices on 16 Jul 24. For other AMs, these proportions are tiny. e.g.: 2% for Liontrust, 1% for Premier Miton.
Again, these significant balance sheet differences between investment-heavy versus investment-light models have to be considered when comparing PERs.
The chart below shows the proportion that net cash plus net investments make up of London-listed AM’s share prices (black bars).
The remaining green bars are therefore an approximation of the value the market assigns to each AM’s fund management business (i.e. earning fees for managing investments on behalf of clients). I say it’s only an approximation because it’s not strictly correct to separate out all cash from the value of the fund management business – working capital is still needed etc – but doing this helps a lot in getting to a more useful PER.

Yep, I agree, there are some weird anomalies going on here!
How can the value of Mercia’s fund management business be negative when it is making decent profits (EBITDA margin c18%)? The value is obviously not negative, the market is clearly assigning a huge discount to the value of its investment portfolio (see my latest Equity Development research note on Mercia - A deeply undervalued specialist in private markets - to read my view which disagrees with this logic).
Is AssetCo’s asset management business really worth almost nothing compared to its net cash and its stake in investment platform Permenion (which makes up the bulk of its net investments)? Have a read of the view of Simon Gibson of the Investors’ Chronicle on this (subscription required): AssetCo’s demerger a catalyst for bumper gains (July 1 2024), and Exploit AssetCo’s hidden value and recovery potential (March 18 2024).
And is Jupiter’s fund management business, which manages £52bn AUM, generates £354m of net management fees and an ‘underlying PBT’ of £98m (before performance fees, impairments of previous acquisitions and amortisation of acquired intangibles – see below), really only worth £76m? (not a perfect way of looking at it I know, but a useful way of thinking about it I reckon).
Now I’m not professing that the market is mispricing all of the above shares, but I am flagging that it certainly looks like the balance sheets of some of these businesses are not being fully considered in the market pricing, or that investors simply don’t believe the value of some of these balance sheets - which are presented in accordance with International Financial Reporting Standards ‘IFRS’.
But how does this knowledge of the balance sheet help us with PER valuations?
U-PER (underlying-PER): an improved metric
Let’s get to the point of this post – constructing a better way to value asset managers. An important caveat to this section is that there is often no single best way to value any business. But the methodology presented below, coupled with a solid DCF model, will certainly provide investors with a much more robust perspective on valuation. The DCF probably gives a better perspective on absolute value. While the U-PER provides a better perspective on relative valuation.
The underlying logic of U-PER is that of a sum-of-the-parts valuation. In asset management, there are typically three ‘parts’ to consider:
A fund management business, where fees are charged for managing funds for third party investors;
An on-balance-sheet investment portfolio, which most asset managers use as a tool to seed funds or to manage as a core part of their business; and
Cash, which is often quite large in the asset management sector.
First, let’s look at the relative valuations of London-listed asset managers, without the value of their investment portfolios and without the value of their net cash.
To do this, I’ll use the U-PER which is calculated as follows:
Adjusted share price (share price less value of on-balance sheet investments per share less value of net cash per share)
divided by
Adjusted EBITDA per share.
[Earnings before interest, tax, depreciation, amortisation, and also before exceptional and non-cash items such as the impairment of acquired intangibles and the gain or impairment of on-balance sheet investments.]
I use the adjusted EBITDA profit metric because:
It strips out many of the causes of earnings volatility highlighted in part 1. Importantly, excluding amortisation from the comparative profit metric also strips out the amortisation of acquired intangibles which can also distort profit comparisons. When asset managers make an acquisition, it is common to record an amount of goodwill on the balance sheet, often described as the ‘value of customer relationships acquired’. Then, the value of this goodwill is amortised over a period of time, with that (non-cash) amortisation amount recorded as an expense on the income statement. These values can be quite large and, in my view, the impact these accounting entries have on profitability doesn’t add any insight to understanding the business.
It is therefore a good (albeit not perfect) measure of pre-tax cash operating profitability of asset managers’ fee-earning fund management businesses, and gives one of the better like-for-like profit comparisons.
Most AMs report this metric as an alternative profit measure (or report something very similar, sometimes using different terms such as ‘underlying PBT’ or ‘core operating profit’). So, it is a relatively easy metric to obtain for most AMs.
The U-PERs of the London-listed peer group being looked at are shown below.

[NB: Remember that these U-PERs will typically be lower than ‘conventional’ PERs because the value of on-balance sheet investments and cash have been stripped out of the share price used in the PER calculation, and adjusted EBITDA per share will usually be higher than basic EPS. So importantly, using these multiples and multiplying them by adjusted EBITDA does not provide a value of the entire business – it ignores the value of net cash and on-balance-sheet investments. It provides a comparison between valuations of standalone fee-earning fund management businesses, ignoring balance sheet strengths or weaknesses.]
A few immediate observations from the above chart:
Contrast the relative lack of outliers and lack of huge divergences between PERs in the above chart to those of the chart of ‘conventional’ PERs in part 1. Most of the dramatic differences have been removed, so we have a much better insight into the premiums or discounts investors are assigning to underlying fund management businesses.
Although this point might not be obvious at first glance if you have not been following the sector closely, but U-PERs provide a much clearer valuation hierarchy. Faster-growing AMs and/or those with strong net inflows generally command premium U-PERs over those that have been growing more slowly, contracting, or suffering net outflows. Gresham House*, Polar, Foresight, ICG and Man Group have been strong recent performers, and command premium U-PERs. Meanwhile, Premier Miton, Liontrust, Ninety One, Ashmore, and Jupiter have had a fairly torrid time recently, mostly recording net outflows in recent periods, and have lower U-PERs.
(*Gresham House’s U-PER does include a further premium as a result of it being acquired in Dec 23).
That all seems to point to the U-PER being a pretty useful tool for looking at the relative values of underlying fund management businesses.
But the real power of this tool comes in when we look at some of the outliers in the U-PER chart. Some of the extremely low and negative U-PERs are worth a second look.
Putting the U-PER to work
Let’s dig into Jupiter in a bit more detail, and if you want to dig into Mercia as well, I’ve gone into this analysis in extensive detail in my latest Equity Development research note - A deeply undervalued specialist in private markets .
Jupiter has a U-PER of just 0.8 compared to a sector median of 6.0. It’s had a tough time recently, absolutely, but surely not as bad as that valuation difference would suggest?
In my recent note covering Polar Capital’s results, I summarised the AUM movements of AMs for the 12 months to 31 Mar 24 in the chart below, and while Jupiter did suffer from outflows, its overall AUM growth was above average.

And while its statutory profits were negative for FY23, as already mentioned they were heavily impacted by non-cash write-downs on the value of goodwill from acquisitions made a few years ago. Underlying PBT (before performance fees) was down 3% y-o-y with an underlying PBT margin of around 27%. Not that bad.
So why would Jupiter’s U-PER be less than one-quarter of the other recent under-performers in the sector (Ashmore, Ninety One, Liontrust and Premier Miton have U-PERs in the 4-4.5 range)? I can’t see a reason for that sort of difference.
Even if we assign Jupiter a ‘laggard’ U-PER of 4.0, that translates to the following U-PER-based valuation on a per share basis:
Value of underlying fund management business (excluding net cash and on-balance sheet investments): 76p [19p (underlying PBT before performance fees per share) x 4.0 (U-PER)]
Value of net cash per share: 43p
Value of net investments per share: 30p
Total U-PER-based value: 149p
That compares to a share price of just 82p on 25 Jul 24. I’m not saying the above is a perfect valuation analysis, but I think it is a really useful starting point to dig a bit deeper, do some more of your own research and see if that sort of valuation gap is justified.
I hope you’ve found this two-part deep dive into asset management PERs useful. I’ll be doing more valuation analyses of the sector in future posts, so be sure to subscribe to TheInvestors.blog below to keep up to date with these posts and with further developments in the UK asset and wealth management sectors.
And if you think TheInvestors.blog is worth telling others about and sharing, I’d be most grateful if you do.
Disclosure: At the time of writing, Paul Bryant was a shareholder in a number of the companies mentioned in this publication, and covered Impax Asset Management, Polar Capital, and Mercia Asset Management as an analyst on behalf of Equity Development Limited. Read Equity Development’s research on Impax Asset Management here, on Polar Capital here, and on Mercia Asset Management here. (Please read this link for the terms and conditions of reading Equity Development’s research).