More juice in Jupiter's jump?
Share price up over 100% from heavily oversold levels. But even after that jump, the bull case looks stronger than the bear case.

TheInvestors.blog is not investment advice. Please read the disclaimer here.
In part 1 of this post, I set the scene for a comparison between UK-listed asset managers Jupiter and Liontrust.

In this part 2, I’ll do a deep dive into Jupiter. Part 3 (coming soon) will be a deep dive into Liontrust. Be sure to subscribe to get notified of when that piece is published.
Jupiter suffered a heavy and prologued share price fall starting around mid-2021 though to April 2025. Then it staged a strong recovery (although the share price is still nowhere near 2021 highs).
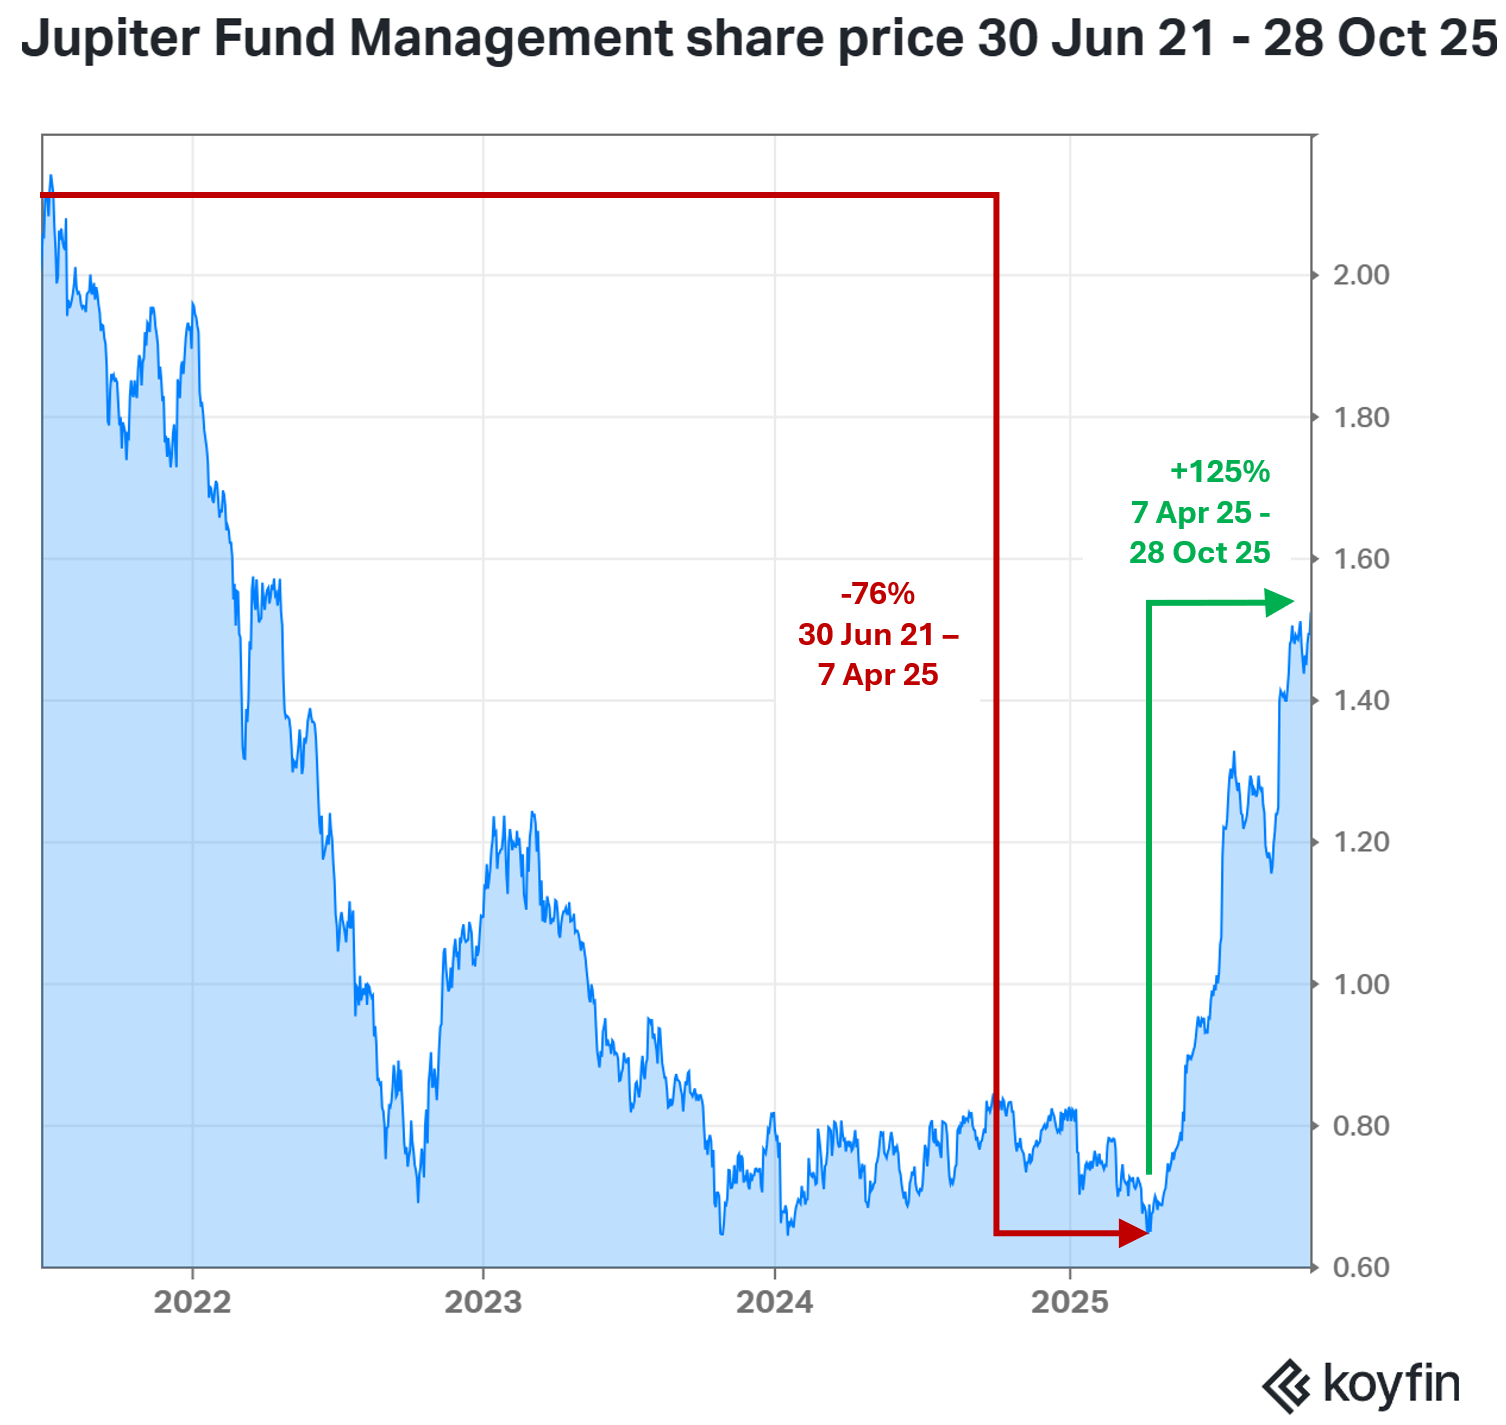
So where to from here? Has the recovery run its course? Or is there more juice to squeeze out of Jupiter’s jump?
I can’t predict the future share price. But in this deep dive I hope to shed some light on a few of the drivers behind Jupiter’s fundamental valuation, and to see what bull-case and bear-case fundamental valuations might look like, and how those differ from the current share price. Note that share prices can deviate from fundamental valuations for quite some time! But hopefully this is a useful insight for those investors doing their own research into Jupiter.
Before jumping in, a disclosure. This is not just a theoretical exercise for me. I am a Jupiter shareholder, sitting on a pretty (paper) profit of >90% (dividends reinvested). My average entry price was around 86p. The share price at the time of publication was around 154p.
My original investment thesis was a recovery play. Jupiter didn’t have to get back to being a high-flyer. It just needed to get back to being a business that wasn’t in decline. That would be enough for a substantial re-rating. So far so good. Now what… Stick or Twist?
Troubles and turnarounds
A quick look back before we look forward.
Current CEO Mathew Beesley was appointed in late-2022. He took on a tough job.
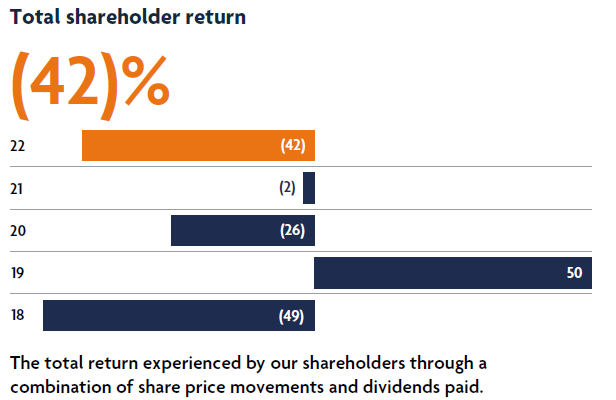
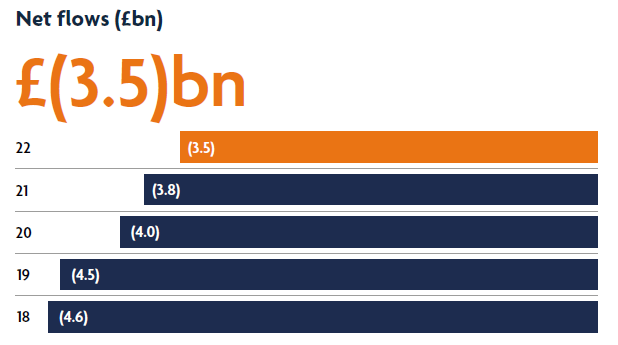
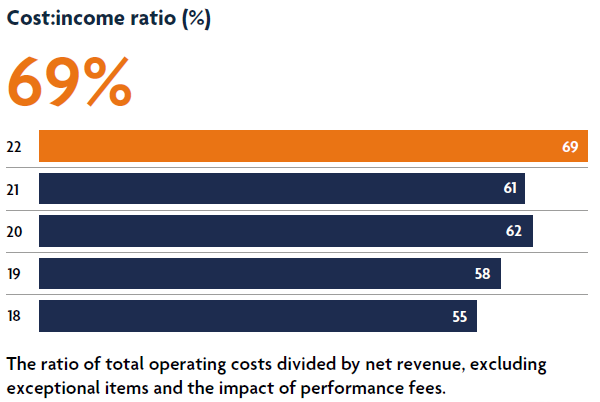
Save for benefitting from the Covid recovery boom in 2019, shareholders had suffered. This chart is from the 2022 annual report.
Clients were pulling their funds.
The only boosts to AUM came from (mostly) strong markets between 2018 and 2021, and the acquisition of Merian Global Investors in 2020, which accounted for all of the AUM boost in that year (£16.6bn of AUM was acquired).
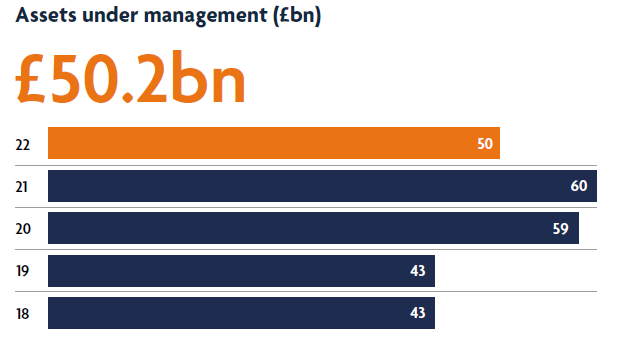
Despite the increase in scale between 2018 and 2021, cost efficiencies were not achieved at group level. And when AUM fell sharply with markets and nervous investors in 2022, the cost to income ratio spiked.
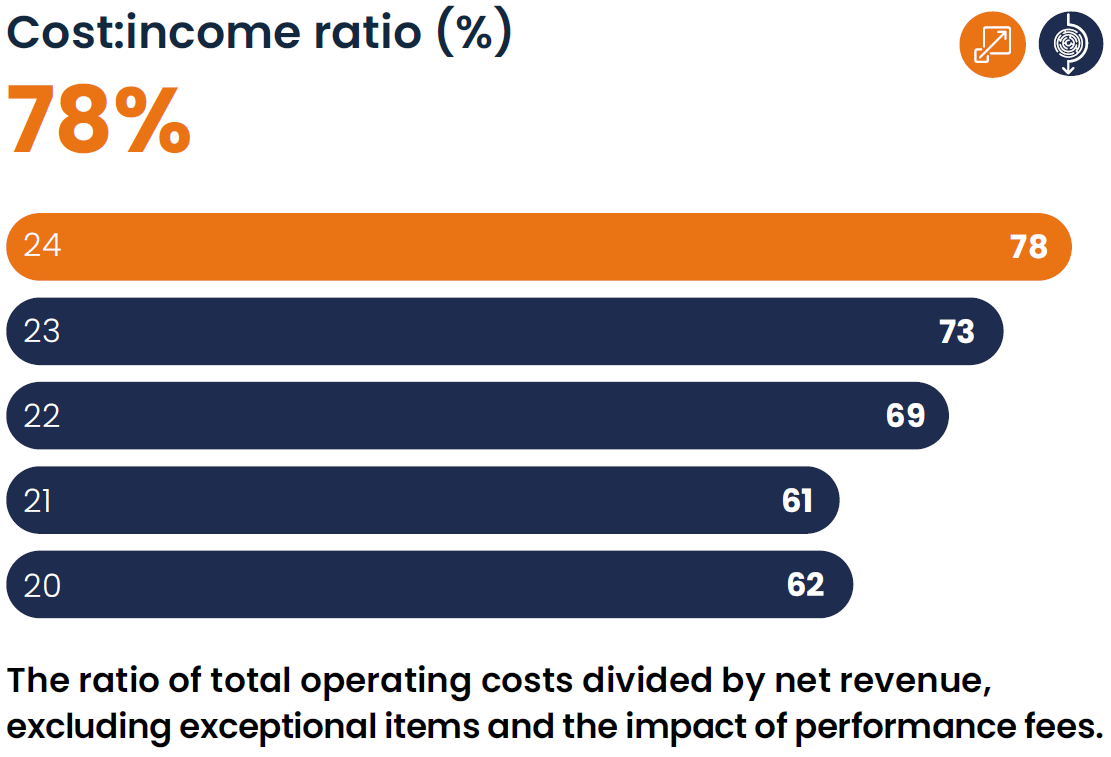
Early in Beesley’s tenure, AUM continued to suffer from repeated hits of heavy and sometimes lumpy outflows (from the retail channel, the loss of an investment management deal with Chrysalis, and star fund managers leaving). This contributed to a further rise in the cost:income ratio. The chart below is from the 2024 annual report.
So, a huge part of Beesley’s first few years was to ‘stop the bleeding’ of AUM, get it growing again, and to trim the cost base. He identified four strategic objectives:
INCREASE SCALE... in select geographies and channels
DECREASE UNDUE COMPLEXITY... with costs managed carefully through a relentless pursuit of efficiency
BROADEN OUR APPEAL TO CLIENTS... with a curated product offering, while exploring new methods of delivery
DEEPEN RELATIONSHIPS WITH ALL STAKEHOLDERS... with purpose and sustainability embedded in all we do
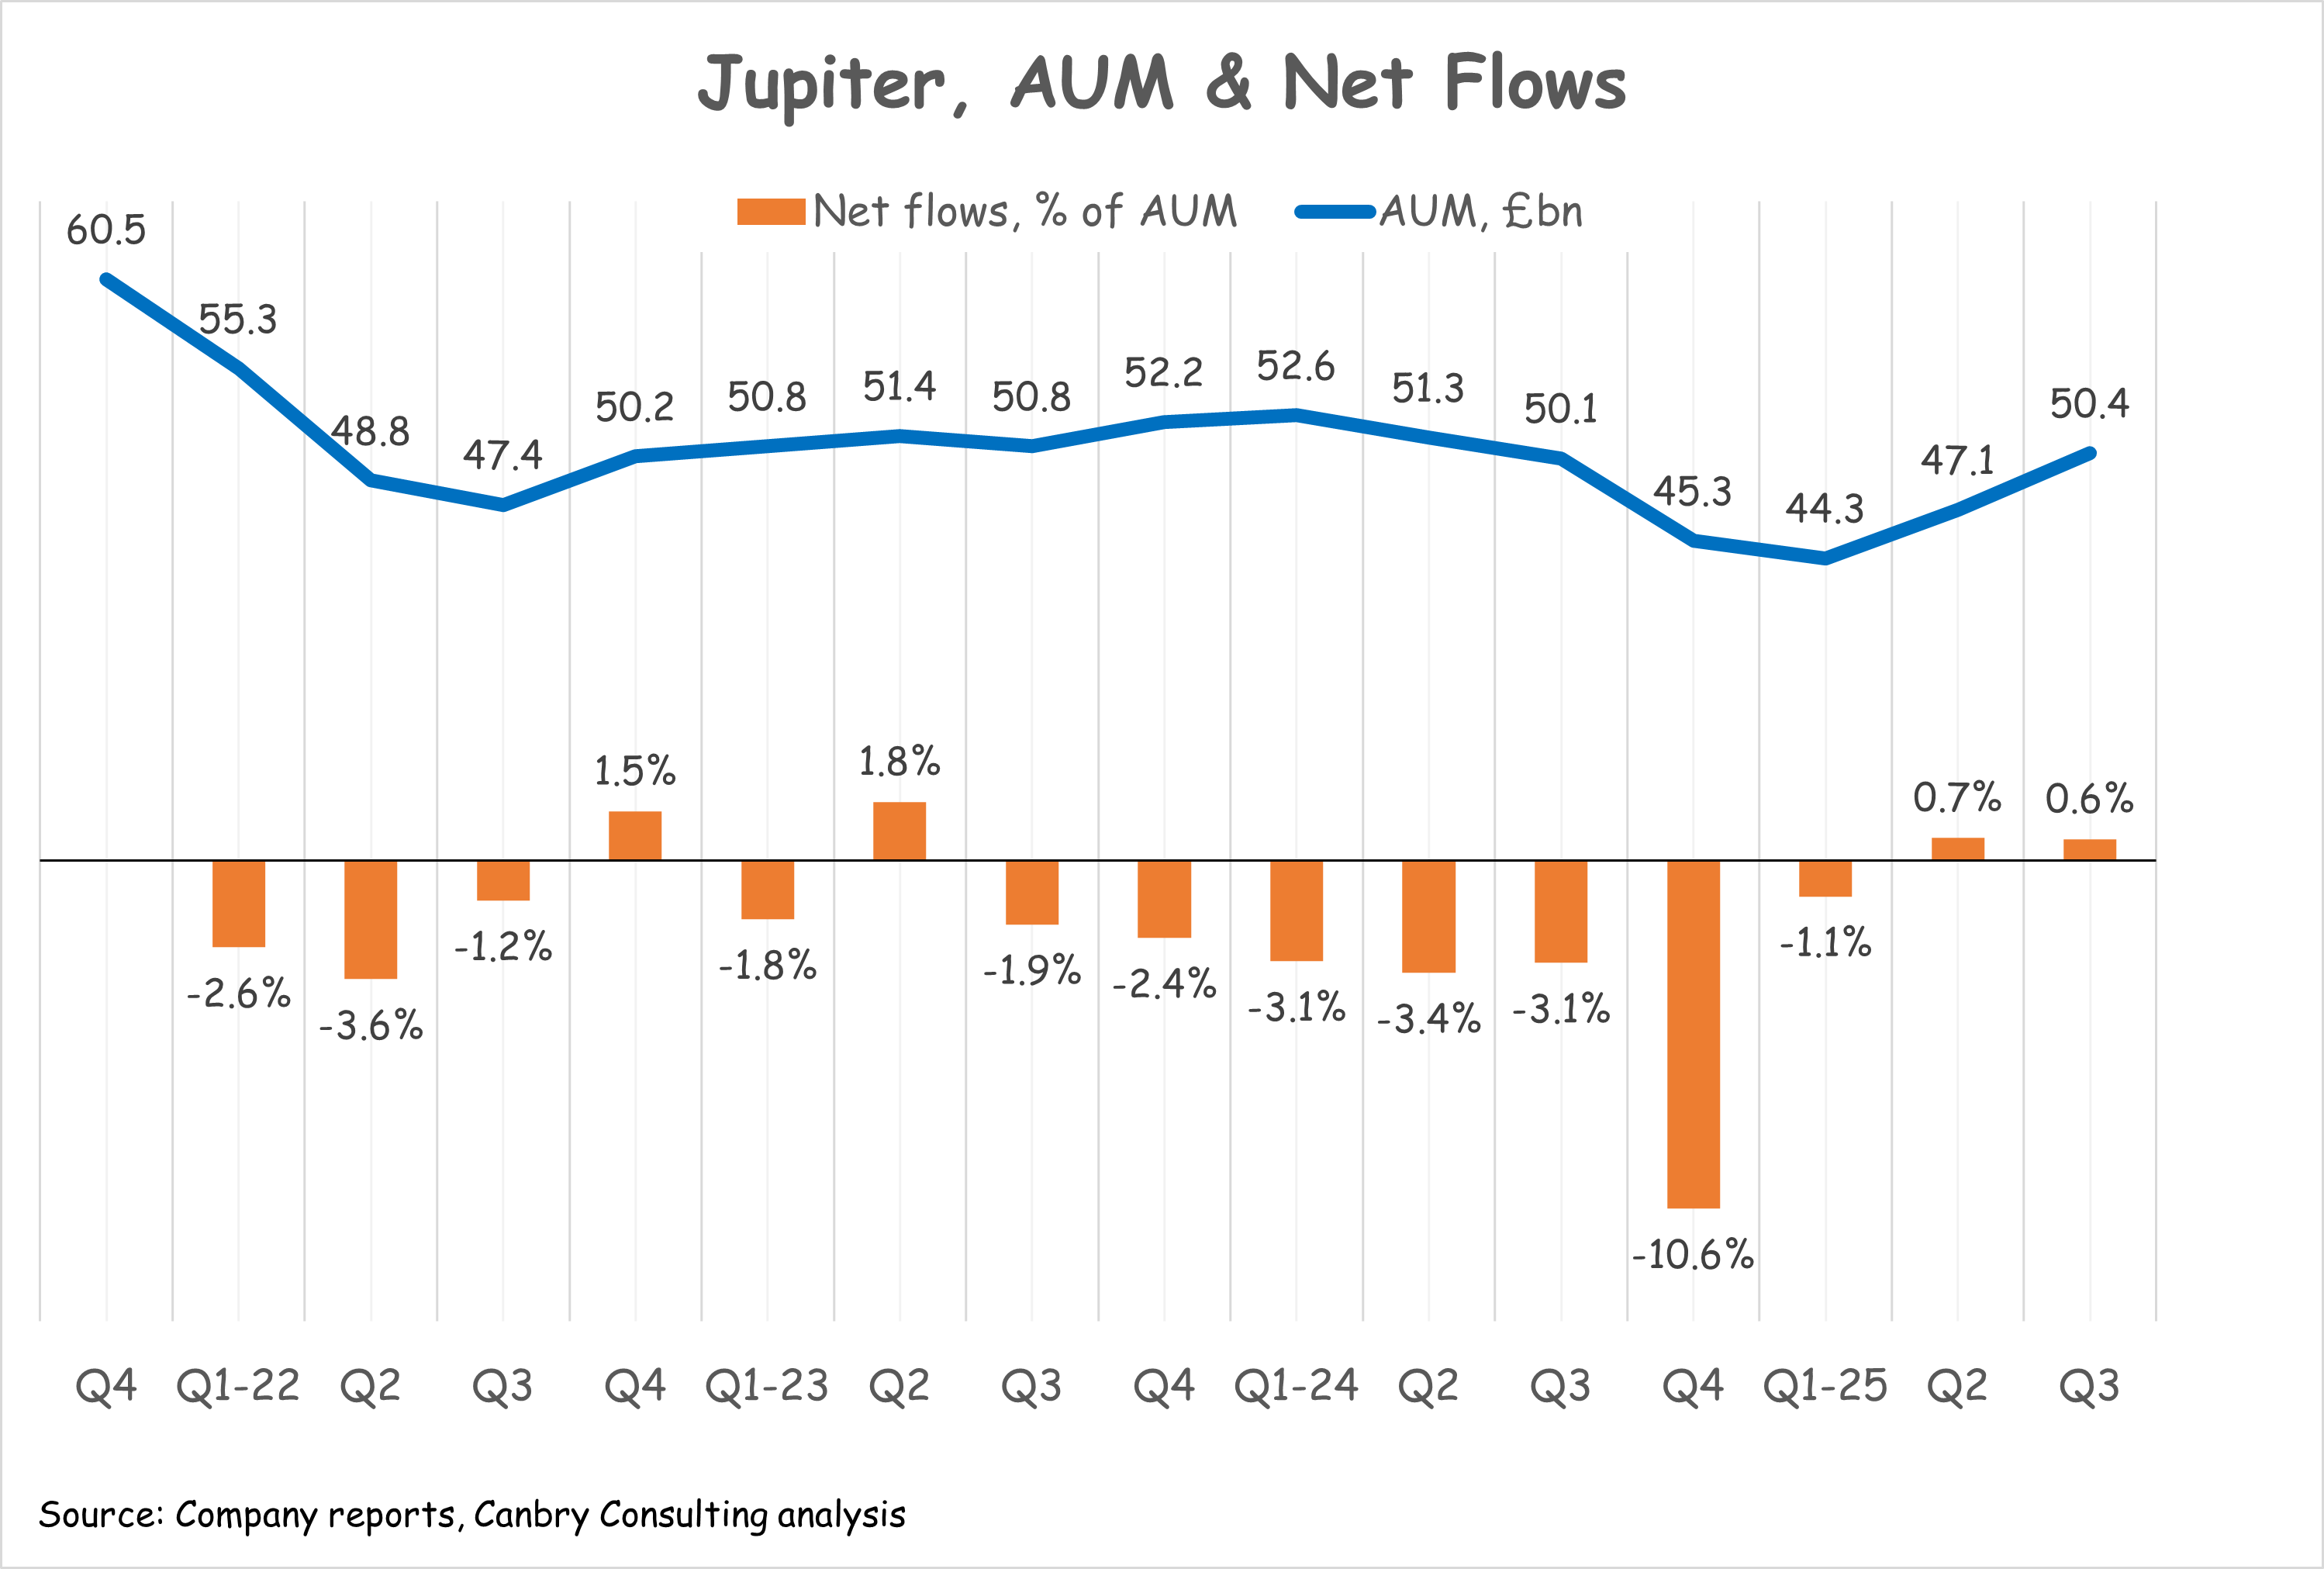
On the scale/AUM front, It looks like he might now be starting to win. AUM and flows have ticked up into positive territory in the last few quarters. For active managers, positive net flows have been the exception rather than the rule in 2025 - so Jupiter’s recent flows are relatively impressive.
There are also positives on the cost front.
Jupiter’s 2024 results stated:
Over the last few years, we have had a particular focus on cost discipline. We announced £20 million of annualised savings in 2022. We delivered lower costs again in 2023, and whilst costs are slightly up this year (2024), we have managed below the guidance we provided at the beginning of the year.
And a May 25 announcement stated:
We have identified further opportunities to deliver cost efficiencies. The initial target is £15m annualised savings, which will be fully implemented on a run rate basis no later than the end of 2026. These annualised savings are in addition to the cost savings already achieved within the management expectations previously provided for 2025, and are one of a number of actions we are taking towards achieving our medium-term target of a 70% cost:income ratio.
But further significant scaling is needed to bring the cost:income ratio down even more and to drive a jump in profits. What are the chances of this happening?
Potential for further scaling?
Clients & geographies
First, let’s look at who Jupiter’s clients are. Mostly, they are retail investors via various channels, including platform and adviser-led channels. Retail, wholesale and the investment trust channels make up 82% of AUM (end Q3-25). Institutional investors make up 18% of AUM. But a key strategy is to grow the institutional channel. Its share of AUM is up from 8% at the end of 2021.
Jupiter operates principally in the UK with international operating subsidiaries in Hong Kong, Ireland, Singapore, Switzerland, and Luxembourg. So, it targets a broad range of international clients.
Products could be well positioned
Now let’s look at what investments Jupiter offers clients. The chart below is from its H1-25 results presentation. Systematic equity strategies are by far the largest product range (26% of AUM), followed by fixed income (16%). Multi-manager (fund-of-funds), global equities, Asian & EM equities, and UK equities each make up around 13% of AUM.
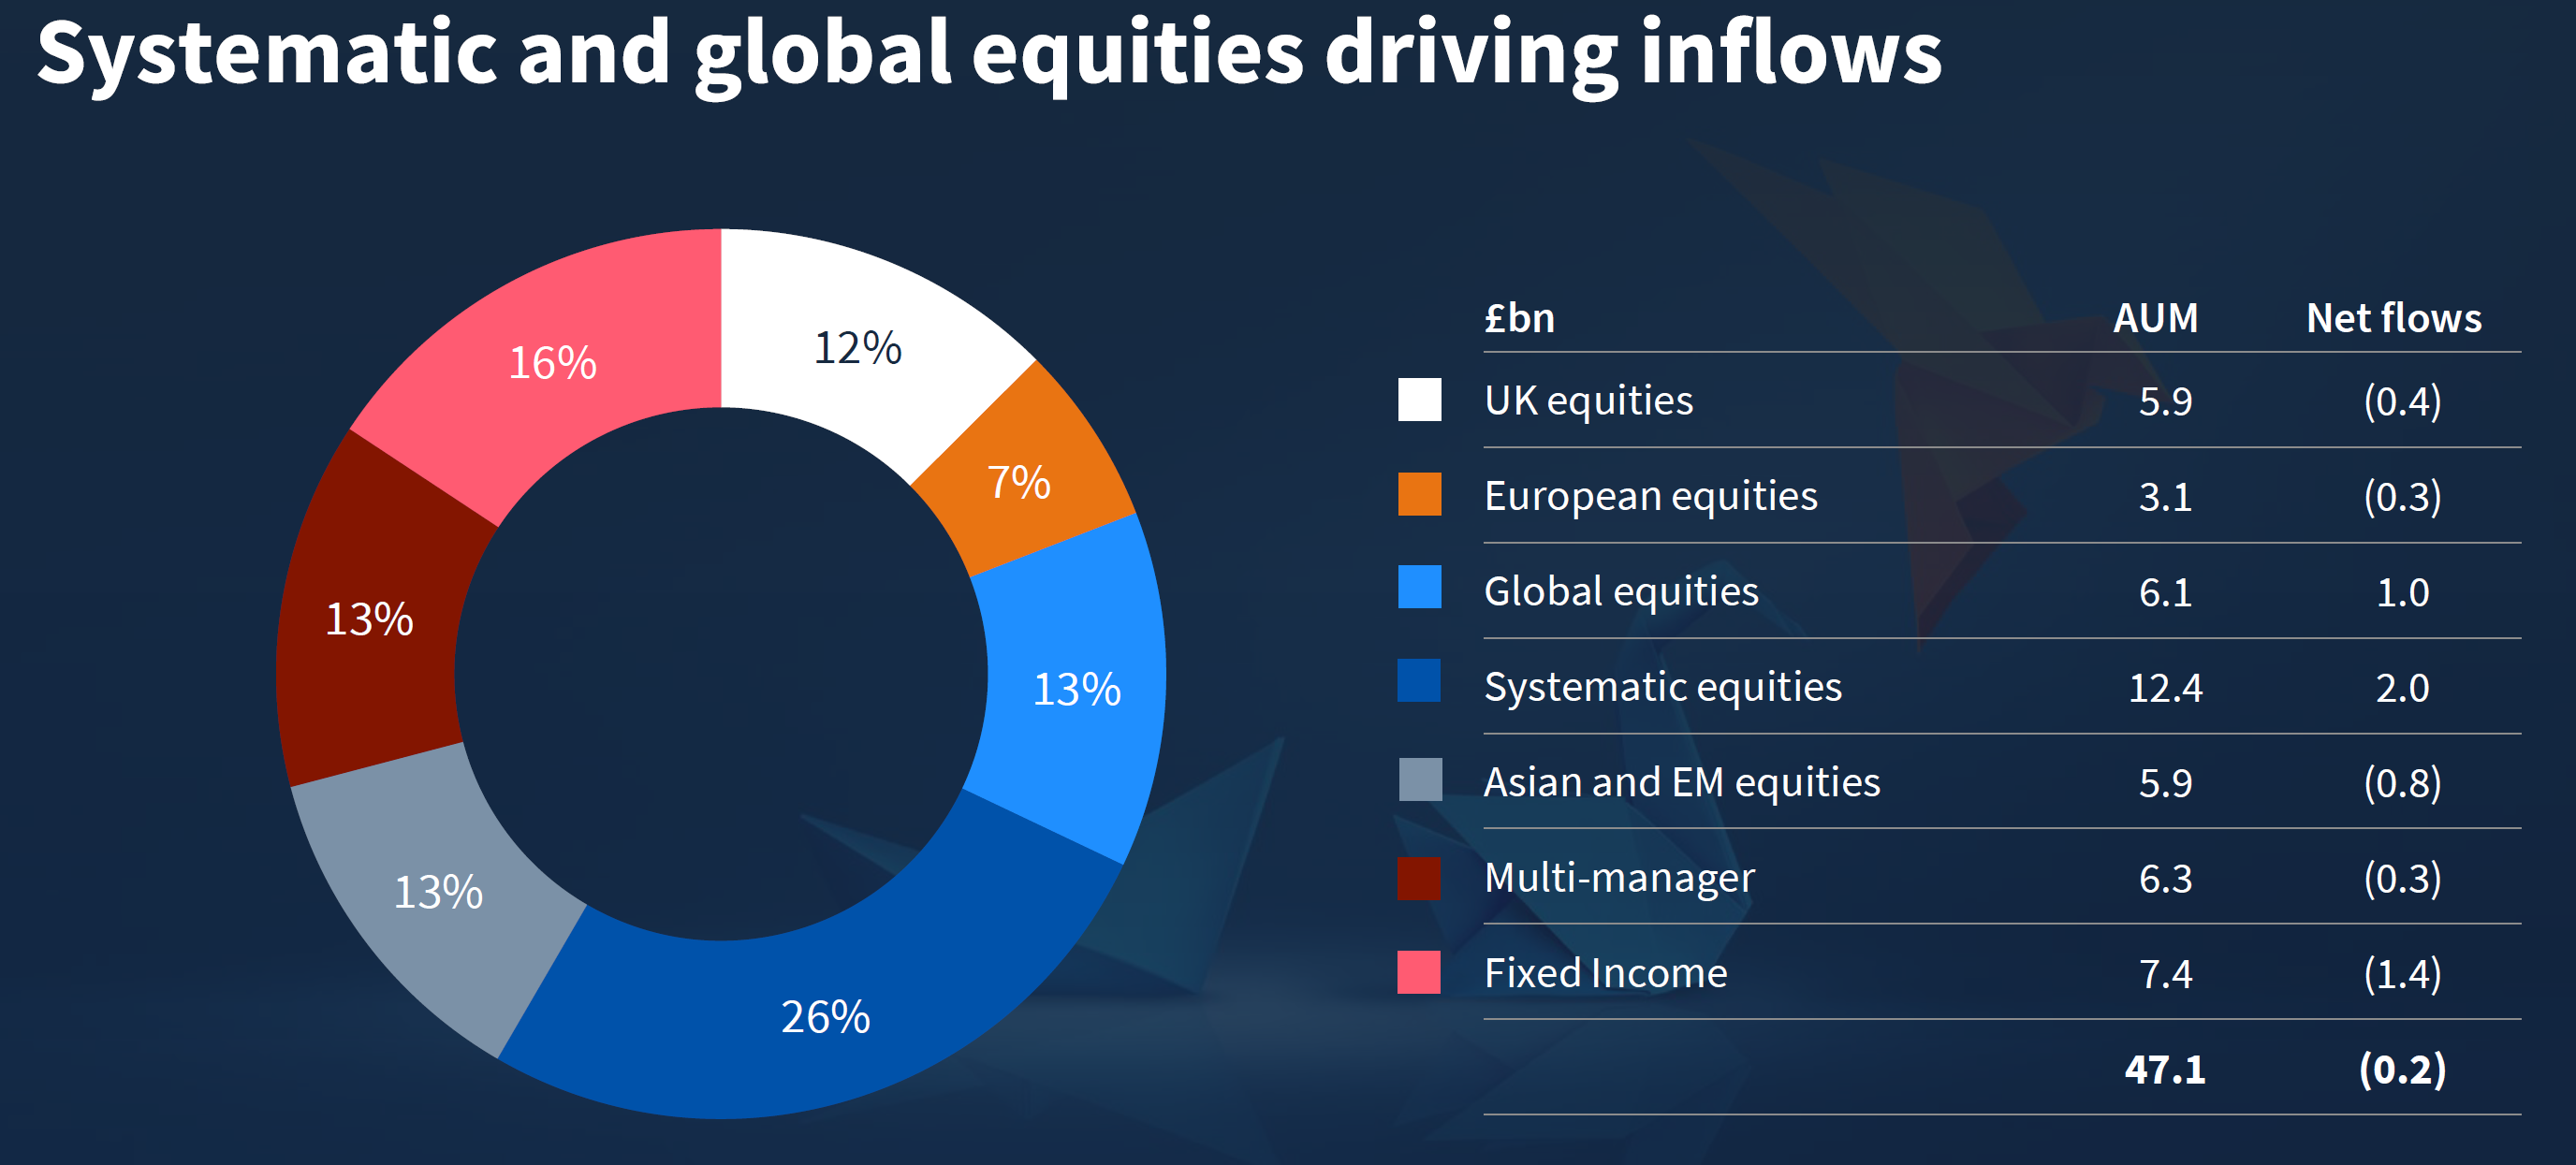
For those not familiar with the term, Systematic equities refers to rules-based or quantitative methods of investing. Here is the link to some of Jupiter’s strategies in this area. And here is an explanation from the Jupiter website:
Unlike discretionary equity strategies, the team employs an evidence-based approach to security selection. Rather than employing traditional analytical techniques, such as manually scrutinising company annual reports, meeting management teams, and studying by hand third-party analysis, the strategy uses computer-based techniques to analyse huge volumes of publicly available information, assessing global stocks against a number of stock selection criteria.
The Jupiter systematic investment process has been built with diversification at its core. It is data-led, rather than opinion-led. The systematic equities team applies a scientific methodology to testing hypotheses and works closely with Jupiter’s data science team.
What strikes me about Jupiter’s product range is:
It looks well positioned to capitalise on any diversification play away from over-concentration in the mag-7.
There may be attractions for investors looking for ‘anti-bubble’ plays: some systematic equity strategies are designed to take advantage of rising and falling markets (some strategies take short positions), and fixed income might be used as a diversification away from highly valued equities.
A continuing flood of money into the mag-7 and passive is probably bad for Jupiter’s growth. Diversification away from these trends might be good for it.
Jupiter is also moving into the active ETF space, which is seen as a potential high-growth area of asset management.
In terms of strategic positioning versus some of the bigger trends in asset management, McKinsey’s latest report, Asset management 2025: The great convergence, is certainly worth a read. It identifies the ETF play and a rotation away from global towards local exposures as growth areas - both of these trends might benefit Jupiter.
Flow outlook positive
Jupiter has certainly struck a positive tone recently in terms of client demand. In its H1-25 interim results it wrote:
Momentum in the Institutional channel continued throughout the period, but the uptick in overall flows was driven by an improvement in demand from retail clients. February saw the greatest level of net outflows from retail clients, but since then we have seen a consistent improvement month-to-month, ending with net positive retail flows in June. Encouragingly, this momentum has continued after period end and we are net positive across both channels so far in July.
And in its Q3 trading update it wrote:
The positive momentum that we saw in the latter part of the first half of 2025 continued into the third quarter.
The improvement in flows was driven by both an improvement in risk appetite amongst clients in the Retail, wholesale and investment trusts channel and ongoing strong investment performance across our differentiated capabilities, partially offset by net outflows in the Institutional channel.
There were total net outflows during the quarter of £0.5bn across the Institutional client channel… As previously stated, flows in the Institutional channel can be lumpy and non-linear, but with overall growth expected over longer periods. Increasing scale in the Institutional channel remains a core strategic focus, our pipeline and client activity remain strong, and we would expect to build on this momentum to drive growth in the medium term.
Investment performance will be key
In terms of investment performance, Jupiter has done relatively well versus peers (chart is from H1-25 results presentation).
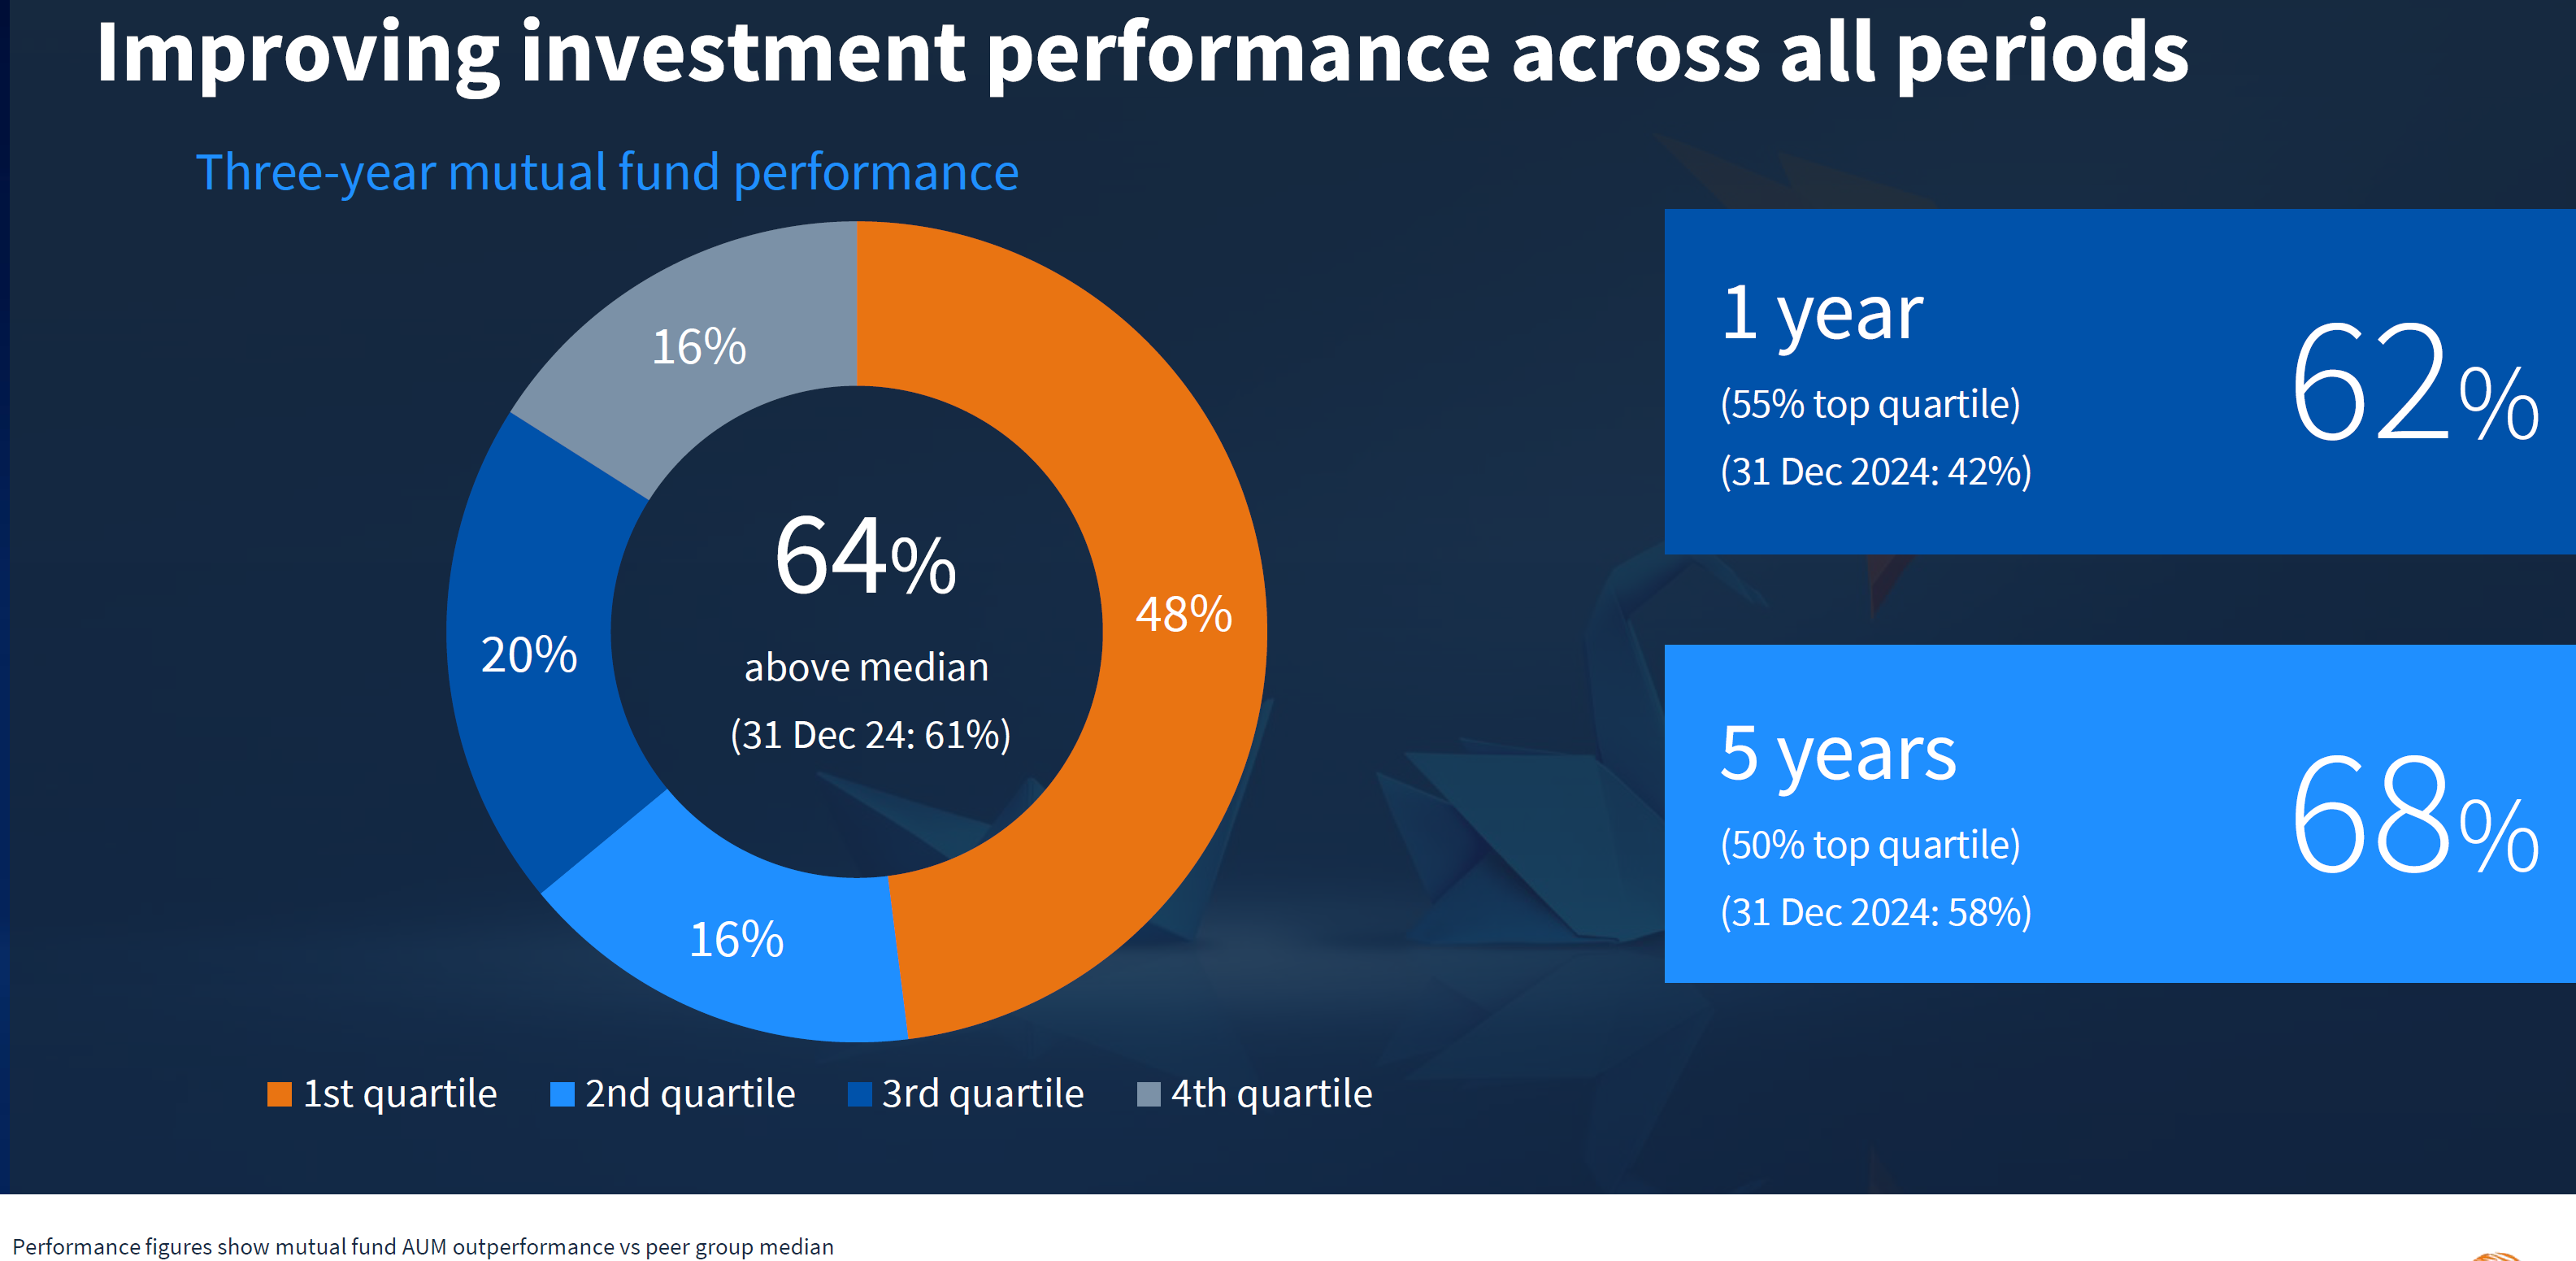
But I reckon real scaling won’t happen because Jupiter outperforms active peers. Jupiter will scale only if a good proportion of clients and potential clients believe that its strategies will add value in a world of rapidly growing passive investment (a world of portfolio concentration in mega-caps).
I am absolutely in the camp that active managers still have a crucial role to play (many disagree with me). But there will only be a small proportion of active ‘winners’. There will be many ‘strugglers’. Which camp Jupiter will end up in - winners or strugglers - is one of the key questions any shareholder or potential shareholder needs to form a view on.
Latest acquisition will help it scale
Scale will certainly receive a boost when its latest acquisition closes (Jupiter says probably in Q1-26). The acquisition of CCLA Investment Management (announced in July 2025), which specialises in the charity sector, was very well received with a jump in Jupiter’s share price on the announcement.
This should add £15bn to Jupiter’s £50bn AUM base. And at a price tag of £100m (funded entirely from cash) for £13m of ‘underlying operating earnings’, it looks like a sensible price. The announcement also put a number to the cost synergies thought to be achievable: £16m per annum by 2027.
Does Jupiter’s potential justify its valuation?
So, I’ve briefly covered historical and recent AUM performance, and the potential for further scaling. The key question now is how the current position and future potential stack up against Jupiter’s current share price.
So let’s dive into valuation.
Lowly valued relative to peers
In a recent post I covered PE-ratio-based valuations in the asset management sector in some detail. I’d strongly recommend reading that if you haven’t already (link below). I think you might find it a real eye-opener.

The key message from that analysis, was that Jupiter’s ‘conventional’ PE ratio of c. 11 (a bit below the sector median of c. 13) could be very misleading. Note: those ratios are at the time of writing that post - at the time of publication of this post, Jupiter’s PE is around 14, the same as the sector median.
That was mainly because Jupiter has significantly more net cash and investments on its balance sheet than most other asset managers. In the above analysis, cash and investments alone made up around 60% of the share price, compared to a sector median of 37%.
If you adjust sector PE ratios to take account of these balance sheet items, and strip out the effect of some distorting exceptional items and non-cash accounting adjustments to earnings, I found that Jupiter’s ‘balance sheet adjusted’ PE ratio is half of the sector median. (full details in the above post ‘Is that chink of light an investment opportunity?’).
That suggests there is valuation headroom on a relative basis compared to other asset managers. But that doesn’t necessarily mean that Jupiter’s fundamental value is out of kilter with the share price. So let’s dig into that in a bit more detail.
Fundamental valuation: bullish and bearish scenarios
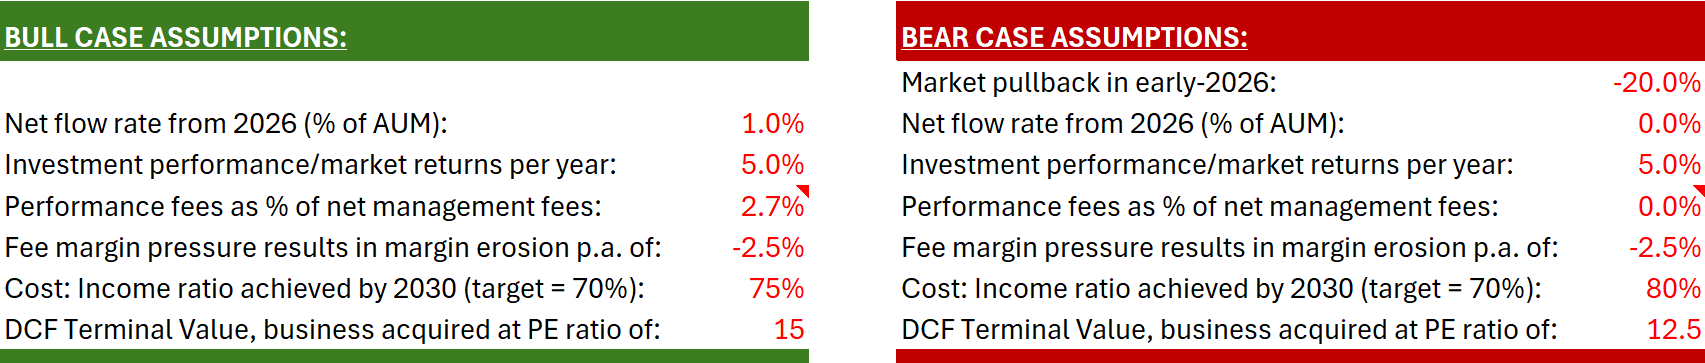
I’ve run two DCF models for Jupiter - a bullish scenario and a bearish one. I wouldn’t call these extreme scenarios. I think both are well within the realms of possibility. Here’s the summary between the two with more detailed explanations below.
Bullish scenario
For the bull case, the major assumptions for a 5-year explicit forecast are:
At the end of 2025, net cash = c. £200m (30 Jun 25: £196m) and net on-balance-sheet investments (seeding of funds etc) = c. £200m (30 Jun 25 £204m).
CCLA acquisition closes Jan 26.
Jupiter attracts net flows (per year) of 1% of AUM. That would be a turnaround in Jupiter’s fortunes compared to the last few years, but as discussed earlier, the net flow outlook is looking more positive. And 1% per year is hardly a demanding net flow rate. In the last strong year for active management flows (2021), the median net flow rate for UK-listed managers was over 5%.
Markets/investment performance contributes 5% per year to AUM.
Average fee margin erodes by 2.5% per year (active managers’ fees are declining).
Jupiter earns performance fees of 2.7% of investment management fees. That’s actually the lowest performance fee level of the last five years, so that assumption is probably conservative. But performance fees are a volatile source of income with no guarantee of being earned at all.
Jupiter achieves a cost:income ratio of 75% in year 5 (it is targeting 70% in the ‘medium term’). In H1-25, this ratio was 82%. I can see it staying above 80% in 2026 but once the synergies from the CCLA acquisition start to be realised, and further scale benefits are realised, it should start to drop. Perhaps my 75% is also a touch conservative?
For the terminal value of the DCF model I assume the business is acquired at a PE ratio of 15 (current sector median is around 14).
Cash flows are discounted at a rate of 12%.
The cash flow projections of this bull case look like this.
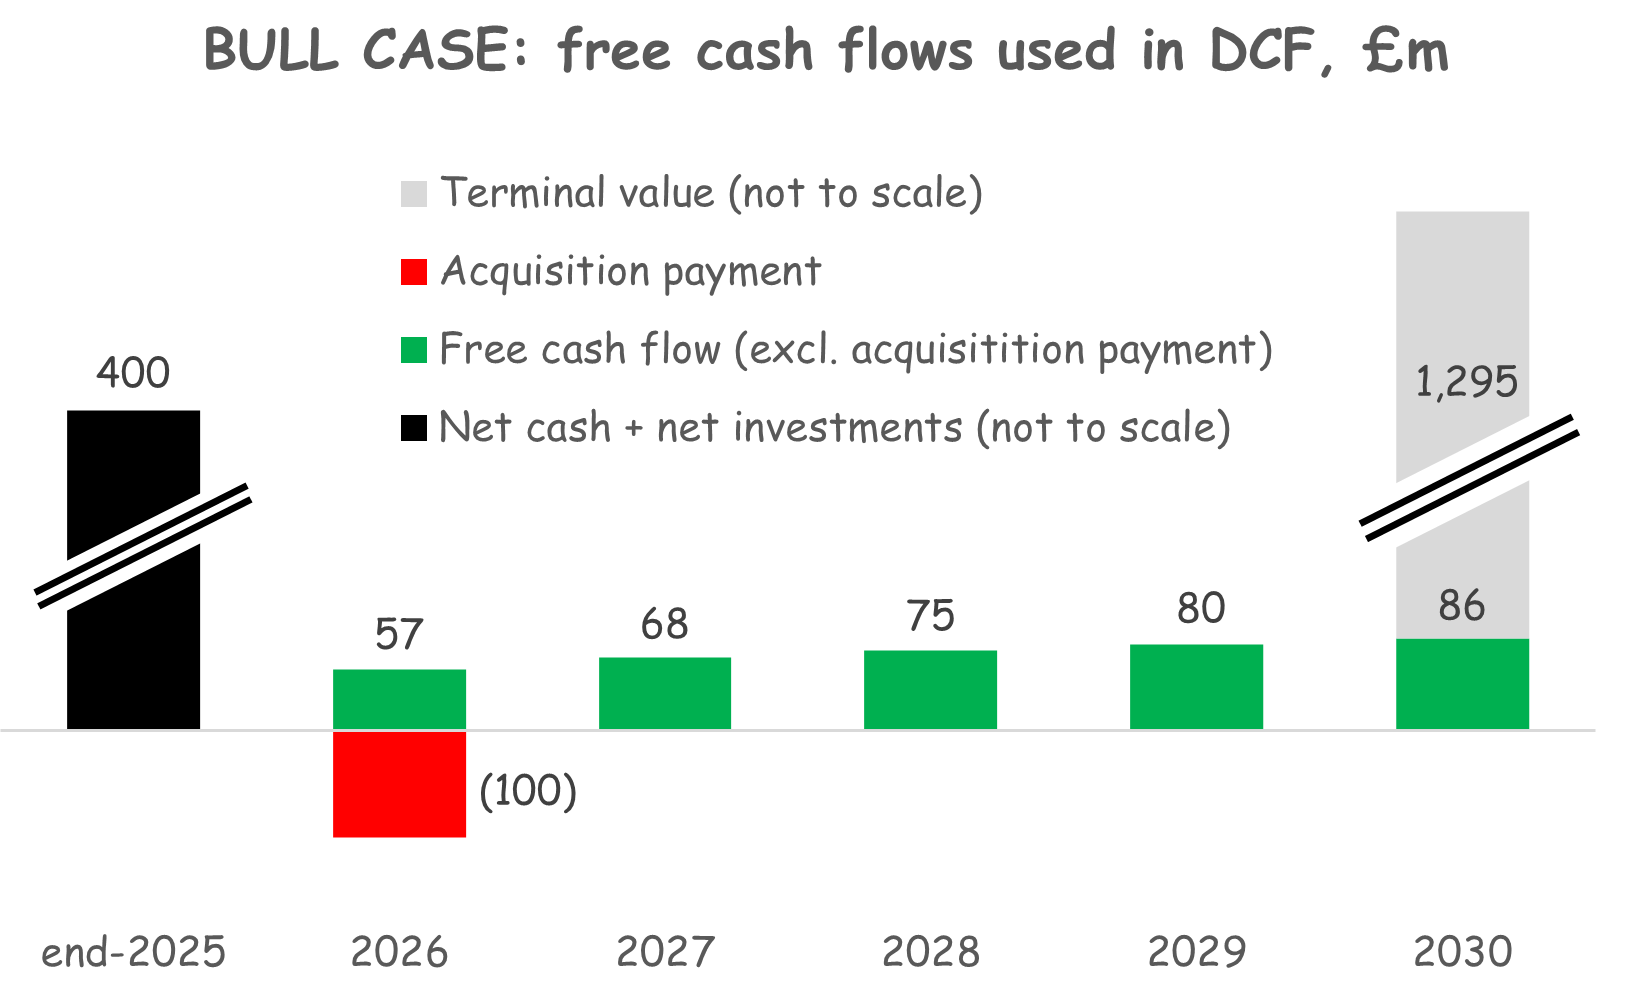
That produces a per share fundamental value of 227p, around 47% above the share price at the time of publication of this post.
Bearish scenario
Now let’s look at a bear case
The major assumptions for a 5-year explicit forecast are:
Markets experience a sharp pullback of 20% in late-25 or early-26 i.e. the “bubble bursts”.
At the end of 2025, net cash = c. £200m (30 Jun 25: £196m) and net on-balance-sheet investments (seeding of funds etc) = c. £160m, reduced by the market pullback assumed above (30 Jun 25 £204m).
CCLA acquisition closes Jan 26.
Net flows average 0% of AUM.
Markets/investment performance contributes 5% per year to AUM.
Average fee margin erodes by 2.5% per year (active managers’ fees are declining).
Jupiter earns no performance fees.
Jupiter achieves a cost:income ratio of 80% in year 5 (it is targeting 70% in the ‘medium term’). In H1-25, this ratio was 82%. The market pullback (and consequent reduction in AUM levels results in the cost:income ratio spiking to the high-80s before declining to 80% in five years.
For the terminal value of the DCF model I assume the business is acquired at a PE ratio of 12.5, lower than the bull case because of the lower growth rate (current sector median is around 14).
Cash flows are discounted at a rate of 12%.
The cash flow projections of this bear case look like this.
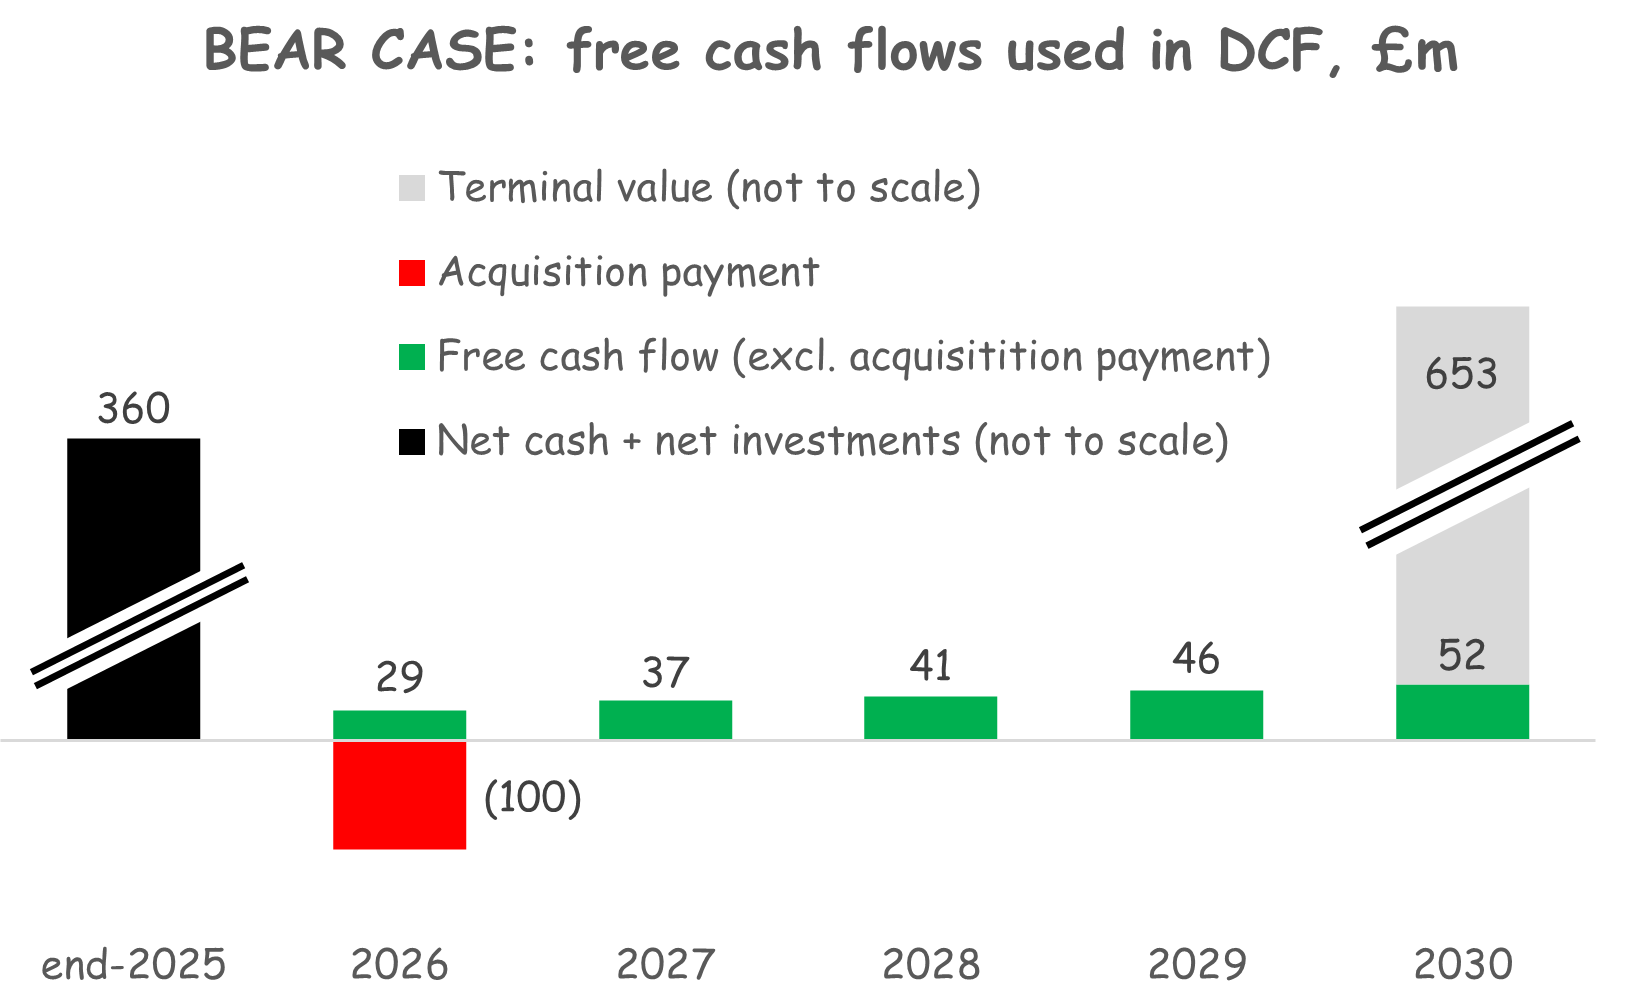
That produces a per share fundamental value of 137p, around 11% below the share price at the time of publication of this post.
Here’s a side-by-side summary of the bull v bear cases:
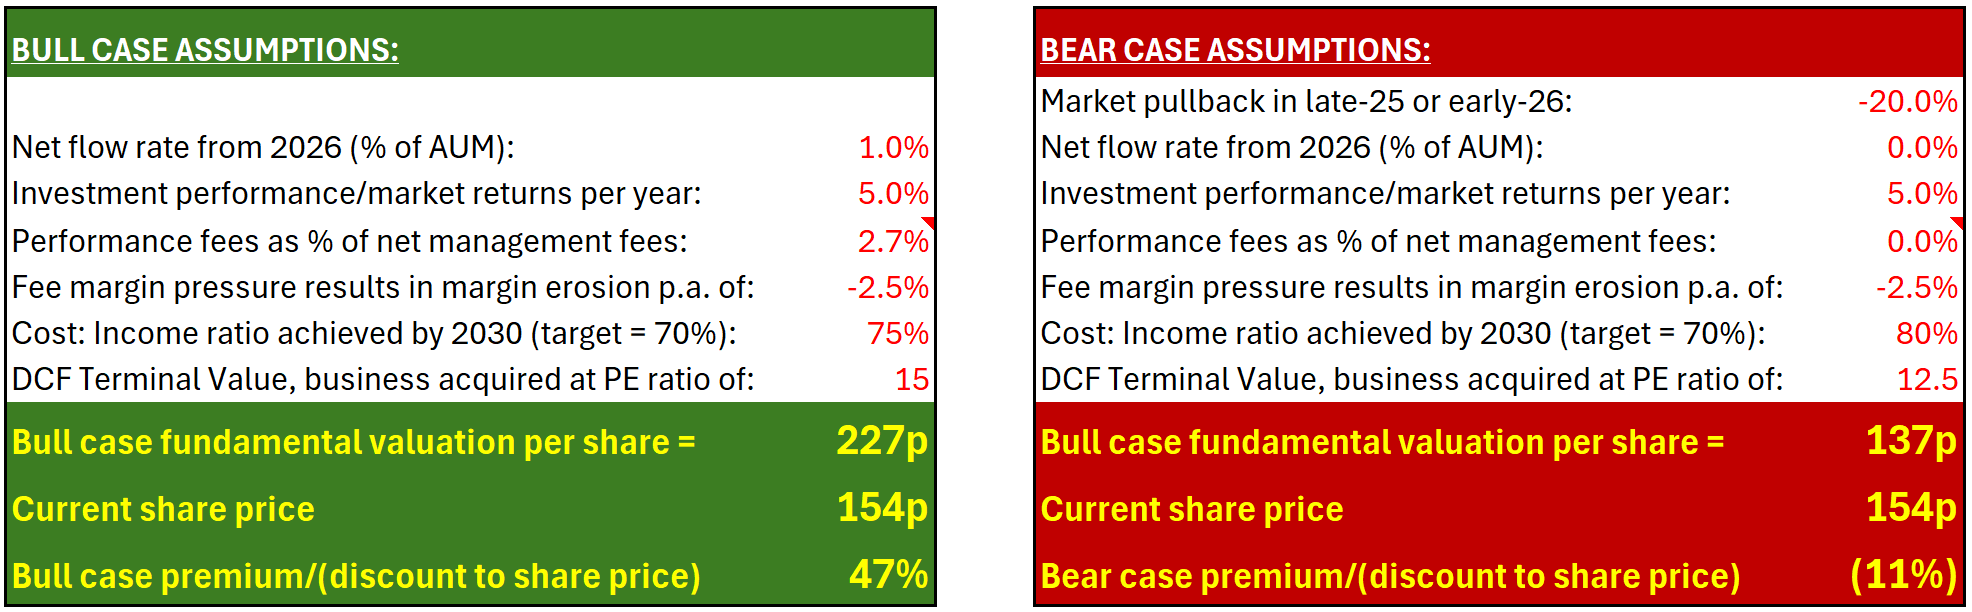
Of course, these are just two scenarios based on a set of assumptions. You’ll have to make your own assessment on what seems most likely to you, and its impact on value. But to me, it still looks like the share price is on the low side of Jupiter’s fundamental value.
Feel free to comment below with your thoughts. And especially, let me know what assumptions you think are the most likely. I can run them through the model and post the impact on fundamental value.
TheInvestors.blog is not investment advice. Please read the disclaimer here.
Be sure to subscribe to TheInvestors.blog below to get notified when the next post of this comparison drops and to keep up to date with the UK asset and wealth management sectors.
And if you think TheInvestors.blog is worth telling others about and sharing, I’d be most grateful if you do.
Disclosure: At the time of writing, Paul Bryant was a shareholder in Jupiter Fund Management.
Thanks for writing this, it clarifies a lot. I definitely agree there could be more juice in the jump. While hitting 2021 highs feels like a distant dreem, your deep dive is very insightful.